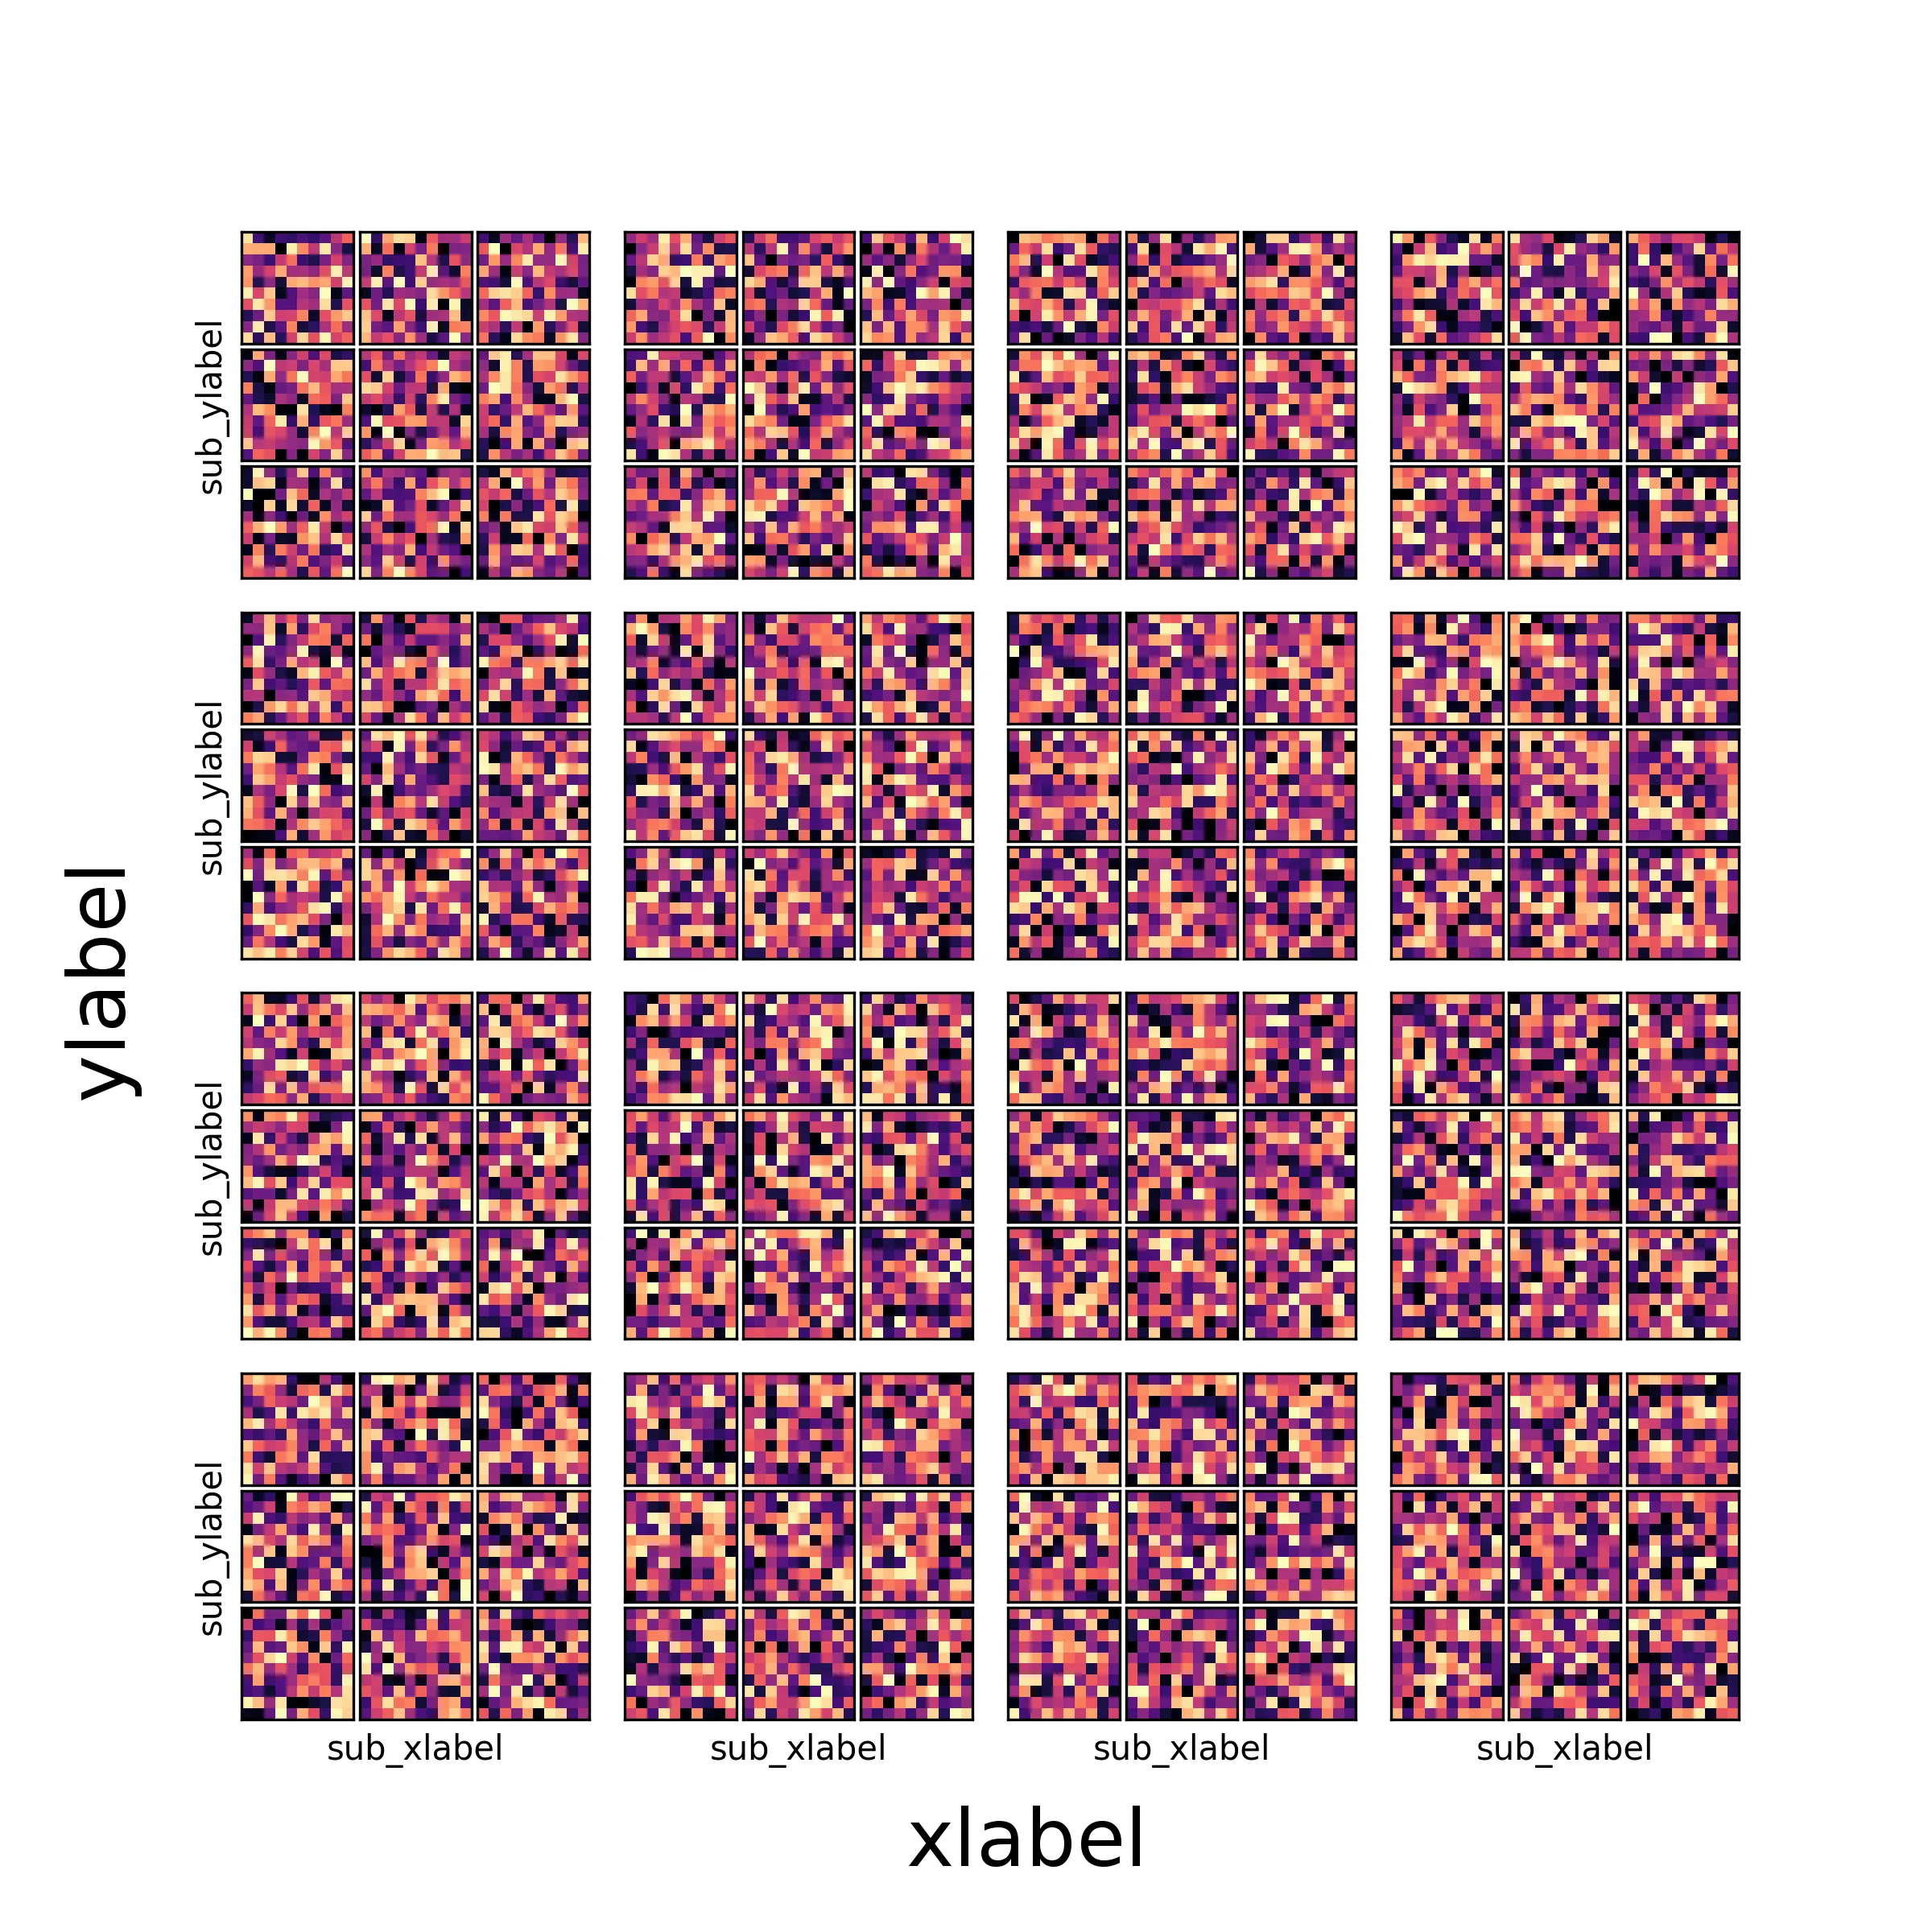
我想给由子子图组成的绘图添加标签。这是我想要的(我用GIMP添加了外部标签)。
这是我实际得到的内容:
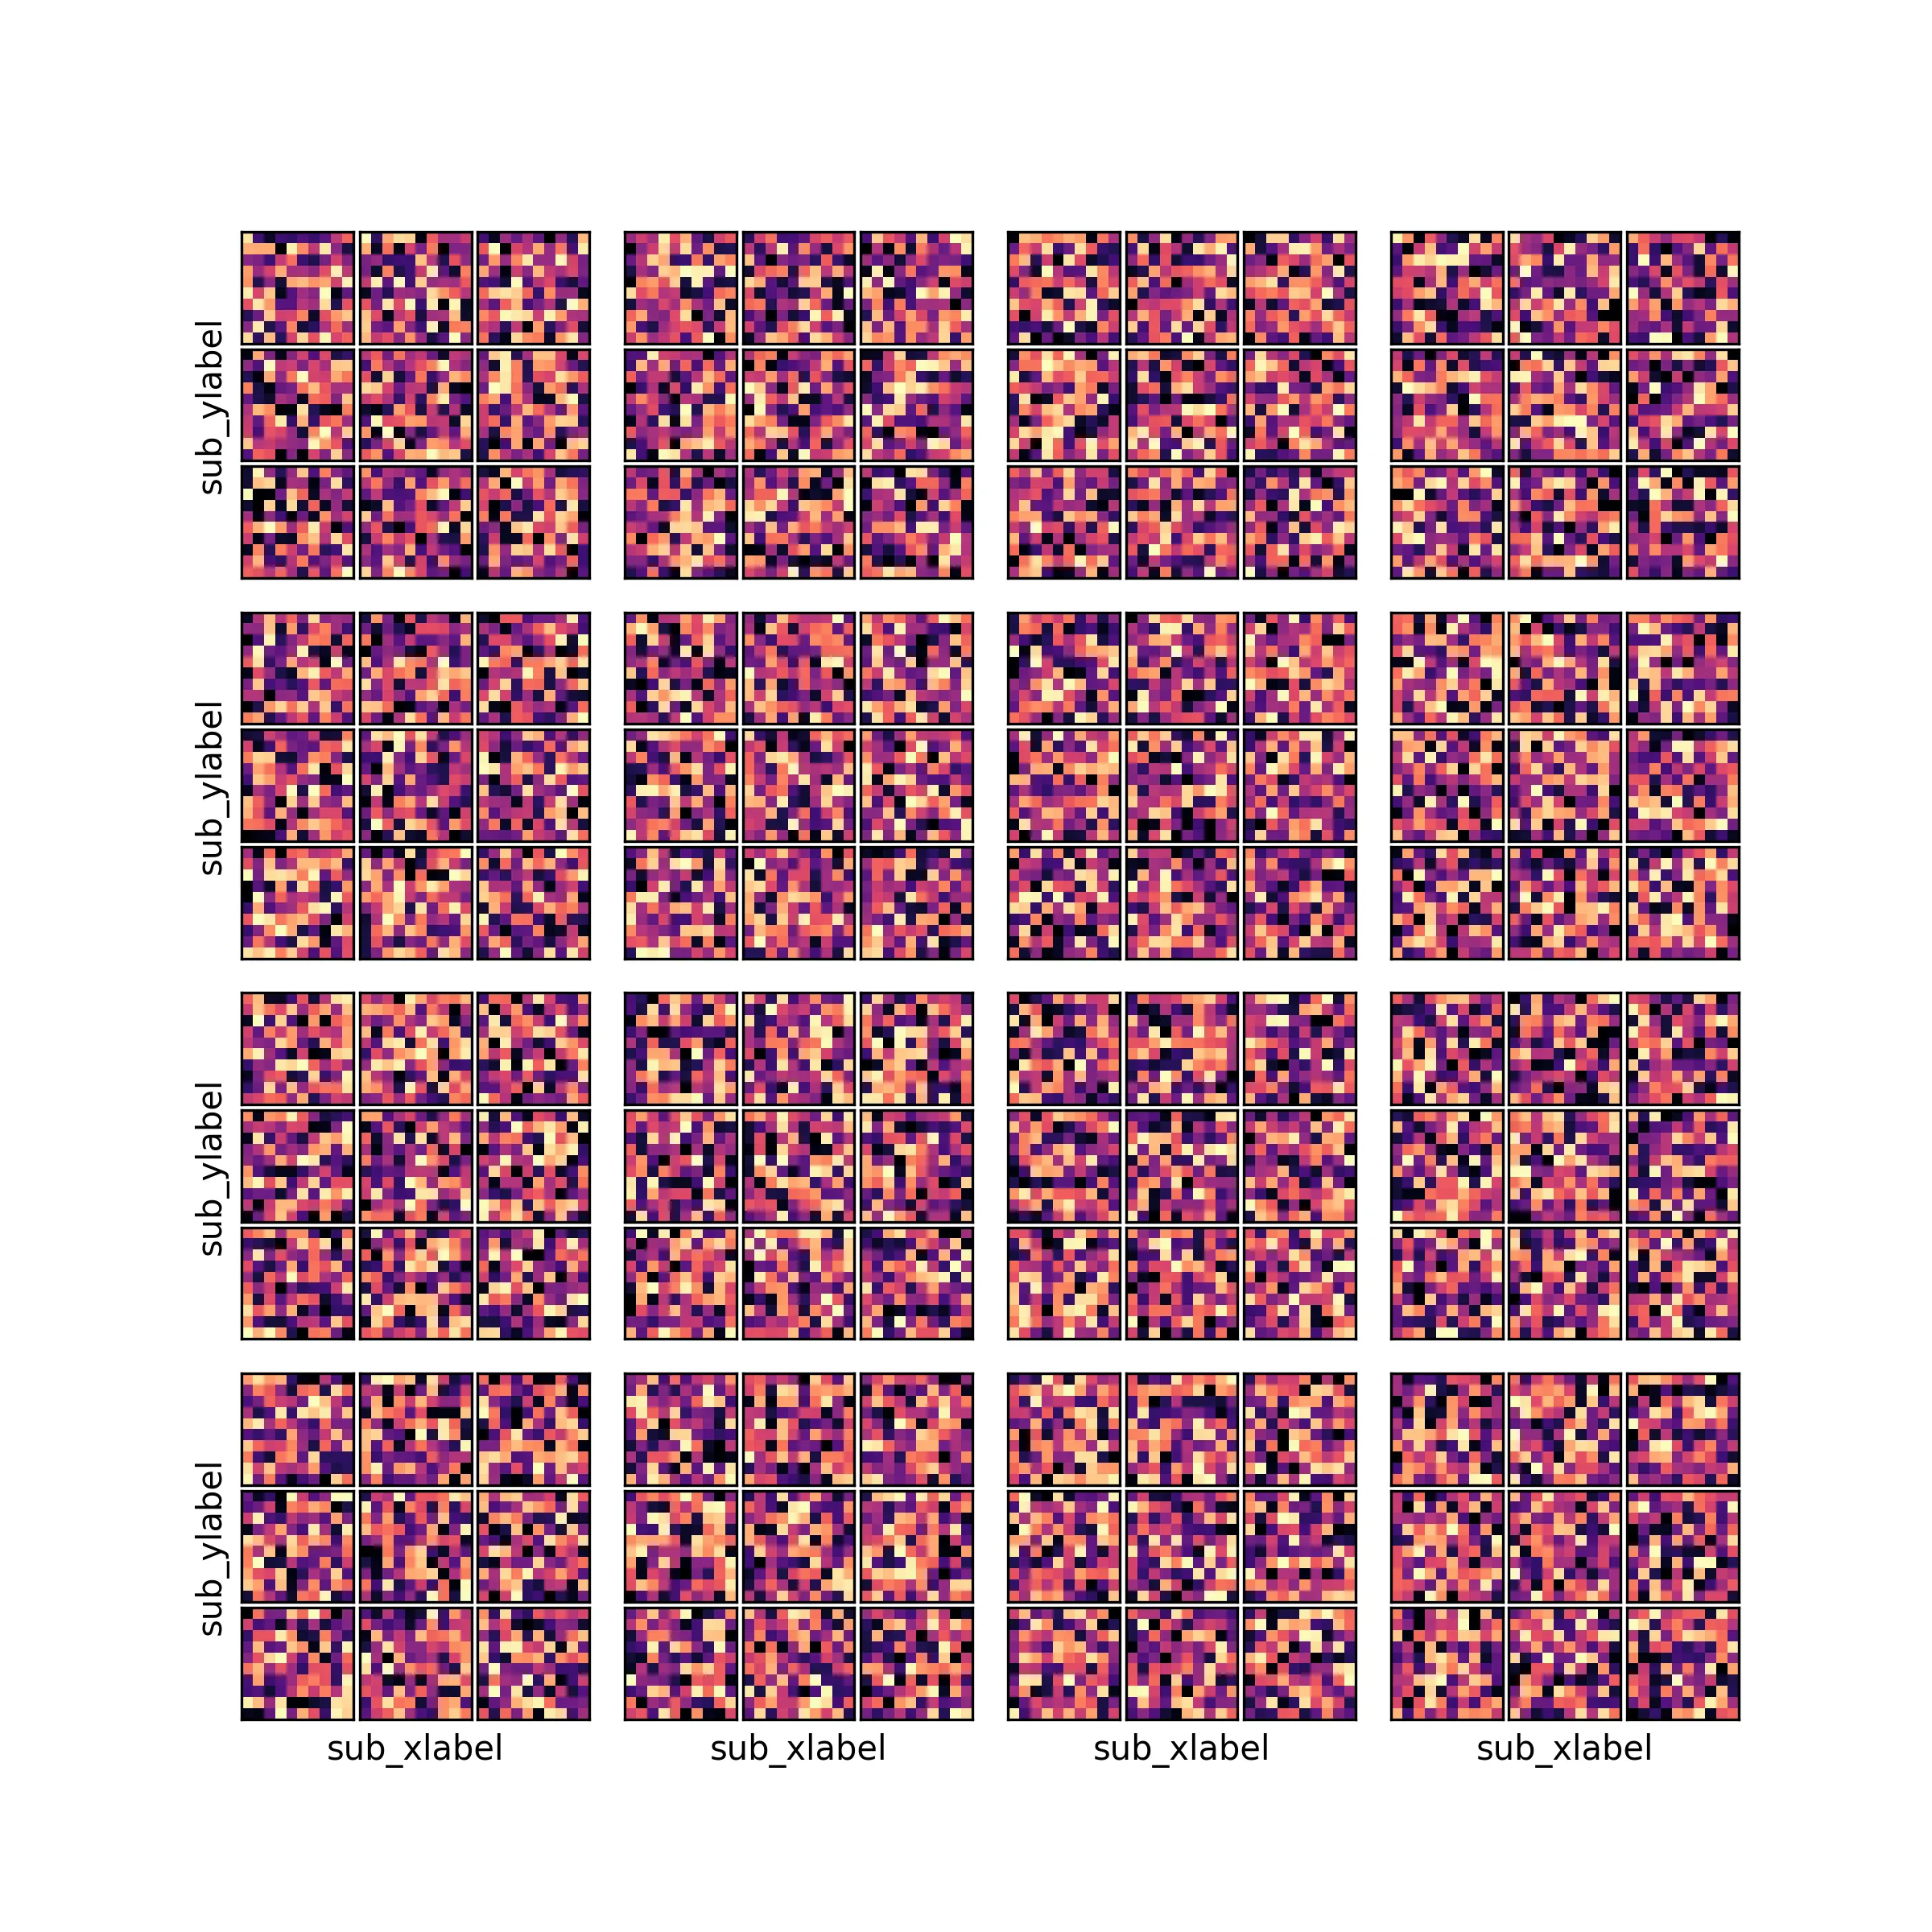
这是生成最后一个图表的代码:
import matplotlib.pyplot as plt
import matplotlib.gridspec as gridspec
import numpy as np

plots = 16
subplots = 9

fig = plt.figure(figsize=(8, 8))

wh_plots = int(np.sqrt(plots))
wh_subplots = int(np.sqrt(subplots))

outer_grid = gridspec.GridSpec(wh_plots, wh_plots, wspace=0.1, hspace=0.1)
for p in range(plots):
    inner_grid = gridspec.GridSpecFromSubplotSpec(wh_subplots, wh_subplots, subplot_spec=outer_grid[p], wspace=0.05, hspace=0.05)
    for s in range(subplots):
        ax = plt.Subplot(fig, inner_grid[s])
        ax.imshow(np.random.rand(10,10), cmap="magma", interpolation="none")
        ax.set_xticks([])
        ax.set_yticks([])
        fig.add_subplot(ax)

        if (p+1) > 12 and s == 7:
            ax.set_xlabel("sub_xlabel")
        if (p) % 4 == 0 and s == 3:
            ax.set_ylabel("sub_ylabel")

all_axes = fig.get_axes()
plt.show()
我的问题:
- How can I get the "xlabel" and "ylabel" as seen in the first plot?
Is there a better way to label the subplots (sub_xlabel / sub_ylabel) compared to what I did?
if (p+1) > 12 and s == 7:
    ax.set_xlabel("sub_xlabel")
if (p) % 4 == 0 and s == 3:
    ax.set_ylabel("sub_ylabel")
它可以工作,但看起来不对。