这是一种可行但不太方便的方法。当设置
xticklabels时,您可以提供一个
position关键字。这允许您在轴坐标中使用负偏移量。如果手动设置轴的位置和它们之间的间距,您可以计算出标签需要的负偏移量,使其恰好位于两个轴之间的中心位置。
给定您的示例数据:
fig = plt.figure(figsize=(10, 2), facecolor='w')
fig.subplots_adjust(wspace=0.2)

ax1 = fig.add_axes([0.0, 0, 0.4, 1])
ax2 = fig.add_axes([0.6, 0, 0.4, 1])

ax1.barh(y, diff, align='center')
ax1.set_yticks(y)
ax1.yaxis.set_major_formatter(matplotlib.ticker.NullFormatter())

ax2.barh(y, data, align='center')
ax2.set_yticks(y)
ax2.set_yticklabels(['reference', 'something', 'something else', 'nothing', ],
                    ha='center', position=(-0.25, 0))
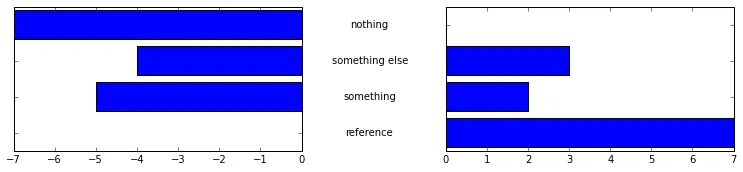
在图形坐标中,两个轴的宽度都为0.4,并且它们之间的间距为0.2。这意味着标签必须位于图形坐标的0.5处。由于第二个轴从0.6开始,因此它需要在图形坐标中偏移-0.1。不幸的是,位置应该以轴坐标给出。轴宽度为0.4,因此轴宽度的四分之一在图形坐标中为0.1。这意味着指定负四分之一的偏移量(-0.25)将标签放置在两个轴之间。希望这样解释清楚了。
请注意,我使用ha ='center'将yticklabels居中。并且居中了您的条形图,因此在设置ticks时无需再指定偏移量。
编辑:
您可以通过读取两个轴的位置来自动执行此操作。
def center_ylabels(ax1, ax2):
pos2 = ax2.get_position()
right = pos2.bounds[0]
pos1 = ax1.get_position()
left = pos1.bounds[0] + pos1.bounds[2]
offset = ((right - left) / pos2.bounds[2]) * -0.5
for yt in ax2.get_yticklabels():
yt.set_position((offset, yt.get_position()[1]))
yt.set_ha('center')
plt.setp(ax2.yaxis.get_major_ticks(), pad=0)
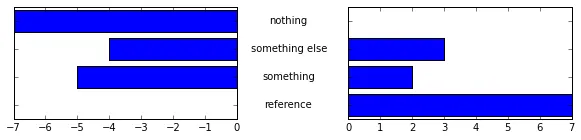
fig, (ax1, ax2) = plt.subplots(1,2, figsize=(10,2))
fig.subplots_adjust(wspace=0.5)
ax1.barh(y, diff, align='center')
ax1.set_yticks(y)
ax1.yaxis.set_major_formatter(matplotlib.ticker.NullFormatter())
ax2.barh(y, data, align='center')
ax2.set_yticks(y)
ax2.set_yticklabels(['reference', 'something', 'something else', 'nothing'])
center_ylabels(ax1, ax2)
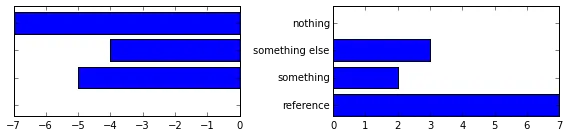
tight_layout之后放置函数center_ylabels(ax1, ax2),因为该函数会干扰轴的位置。 - undefined