我正在尝试使用matplotlib复制某个图形:它应该看起来像这样。
 我已经了解到可以使用极坐标轴(PolarAxes)绘制径向点:例如,我使用以下片段创建了一个非常简单的极坐标图。
我得到了下面这样的图像:
所以我的问题是:是否有一种方法可以绘制如第一个图中的线条,并调整宽度以适应整个圆周?另外,关于如何处理颜色的提示将非常感谢。
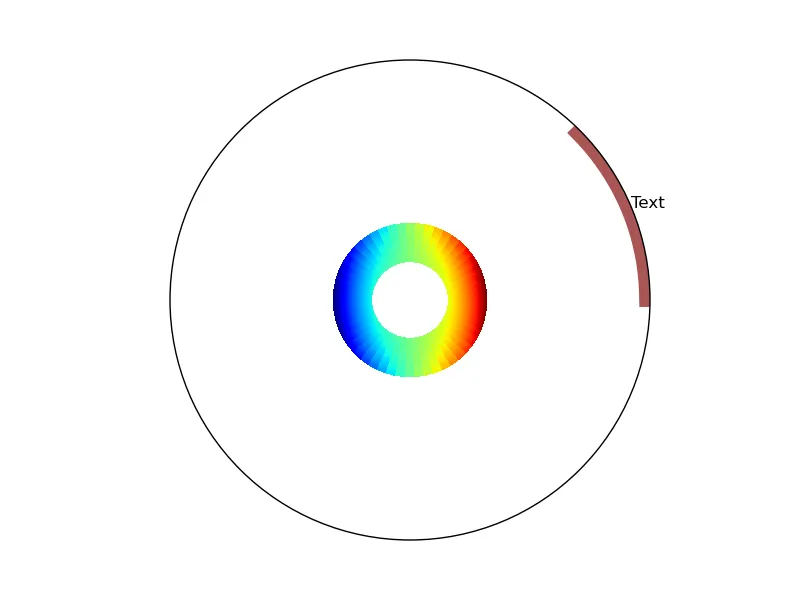
更新:要绘制的数据非常简单:每个轨迹都是一个浮点数数组,其范围在0到9之间(颜色是从颜色映射RdYlGn派生的)。数组长度是96的倍数。
更新2:这是我使用的代码片段。
我已经了解到可以使用极坐标轴(PolarAxes)绘制径向点:例如,我使用以下片段创建了一个非常简单的极坐标图。import matplotlib.pyplot as plt
fig = plt.figure()
# Set the axes as polar
ax = fig.add_subplot(111, polar=True)
# Draw some points
ax.plot([0],[1], 'o')
ax.plot([3],[1], 'o')
ax.plot([6],[1], 'o')
# Go clockwise
ax.set_theta_direction(-1)
# Start from the top
ax.set_theta_offset(1.570796327)
plt.savefig('test.png')
我得到了下面这样的图像:
所以我的问题是:是否有一种方法可以绘制如第一个图中的线条,并调整宽度以适应整个圆周?另外,关于如何处理颜色的提示将非常感谢。
更新:要绘制的数据非常简单:每个轨迹都是一个浮点数数组,其范围在0到9之间(颜色是从颜色映射RdYlGn派生的)。数组长度是96的倍数。
更新2:这是我使用的代码片段。
# mydata is a simple list of floats
a = np.array([[x for i in range(10)] for x in mydata])

# construct the grid
radius = np.linspace(0.2,0.4,10)
theta = np.linspace(0,2*np.pi,len(a))
R,T  = np.meshgrid(radius,theta)

fig = plt.figure()
ax = fig.add_subplot(111, polar = True)

# plot the values using the appropriate colormap
ax.pcolor(T,R,a,cmap=cm.RdYlGn)