1个回答
11
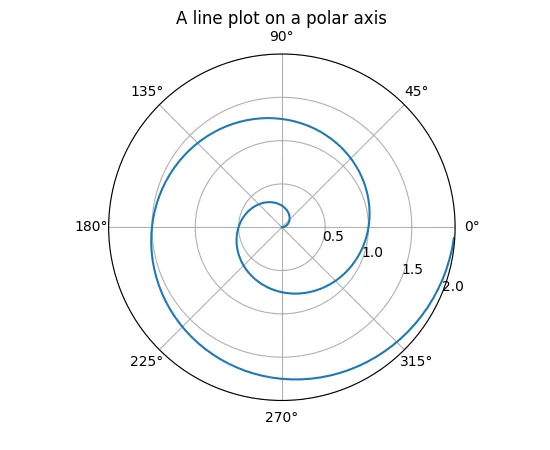
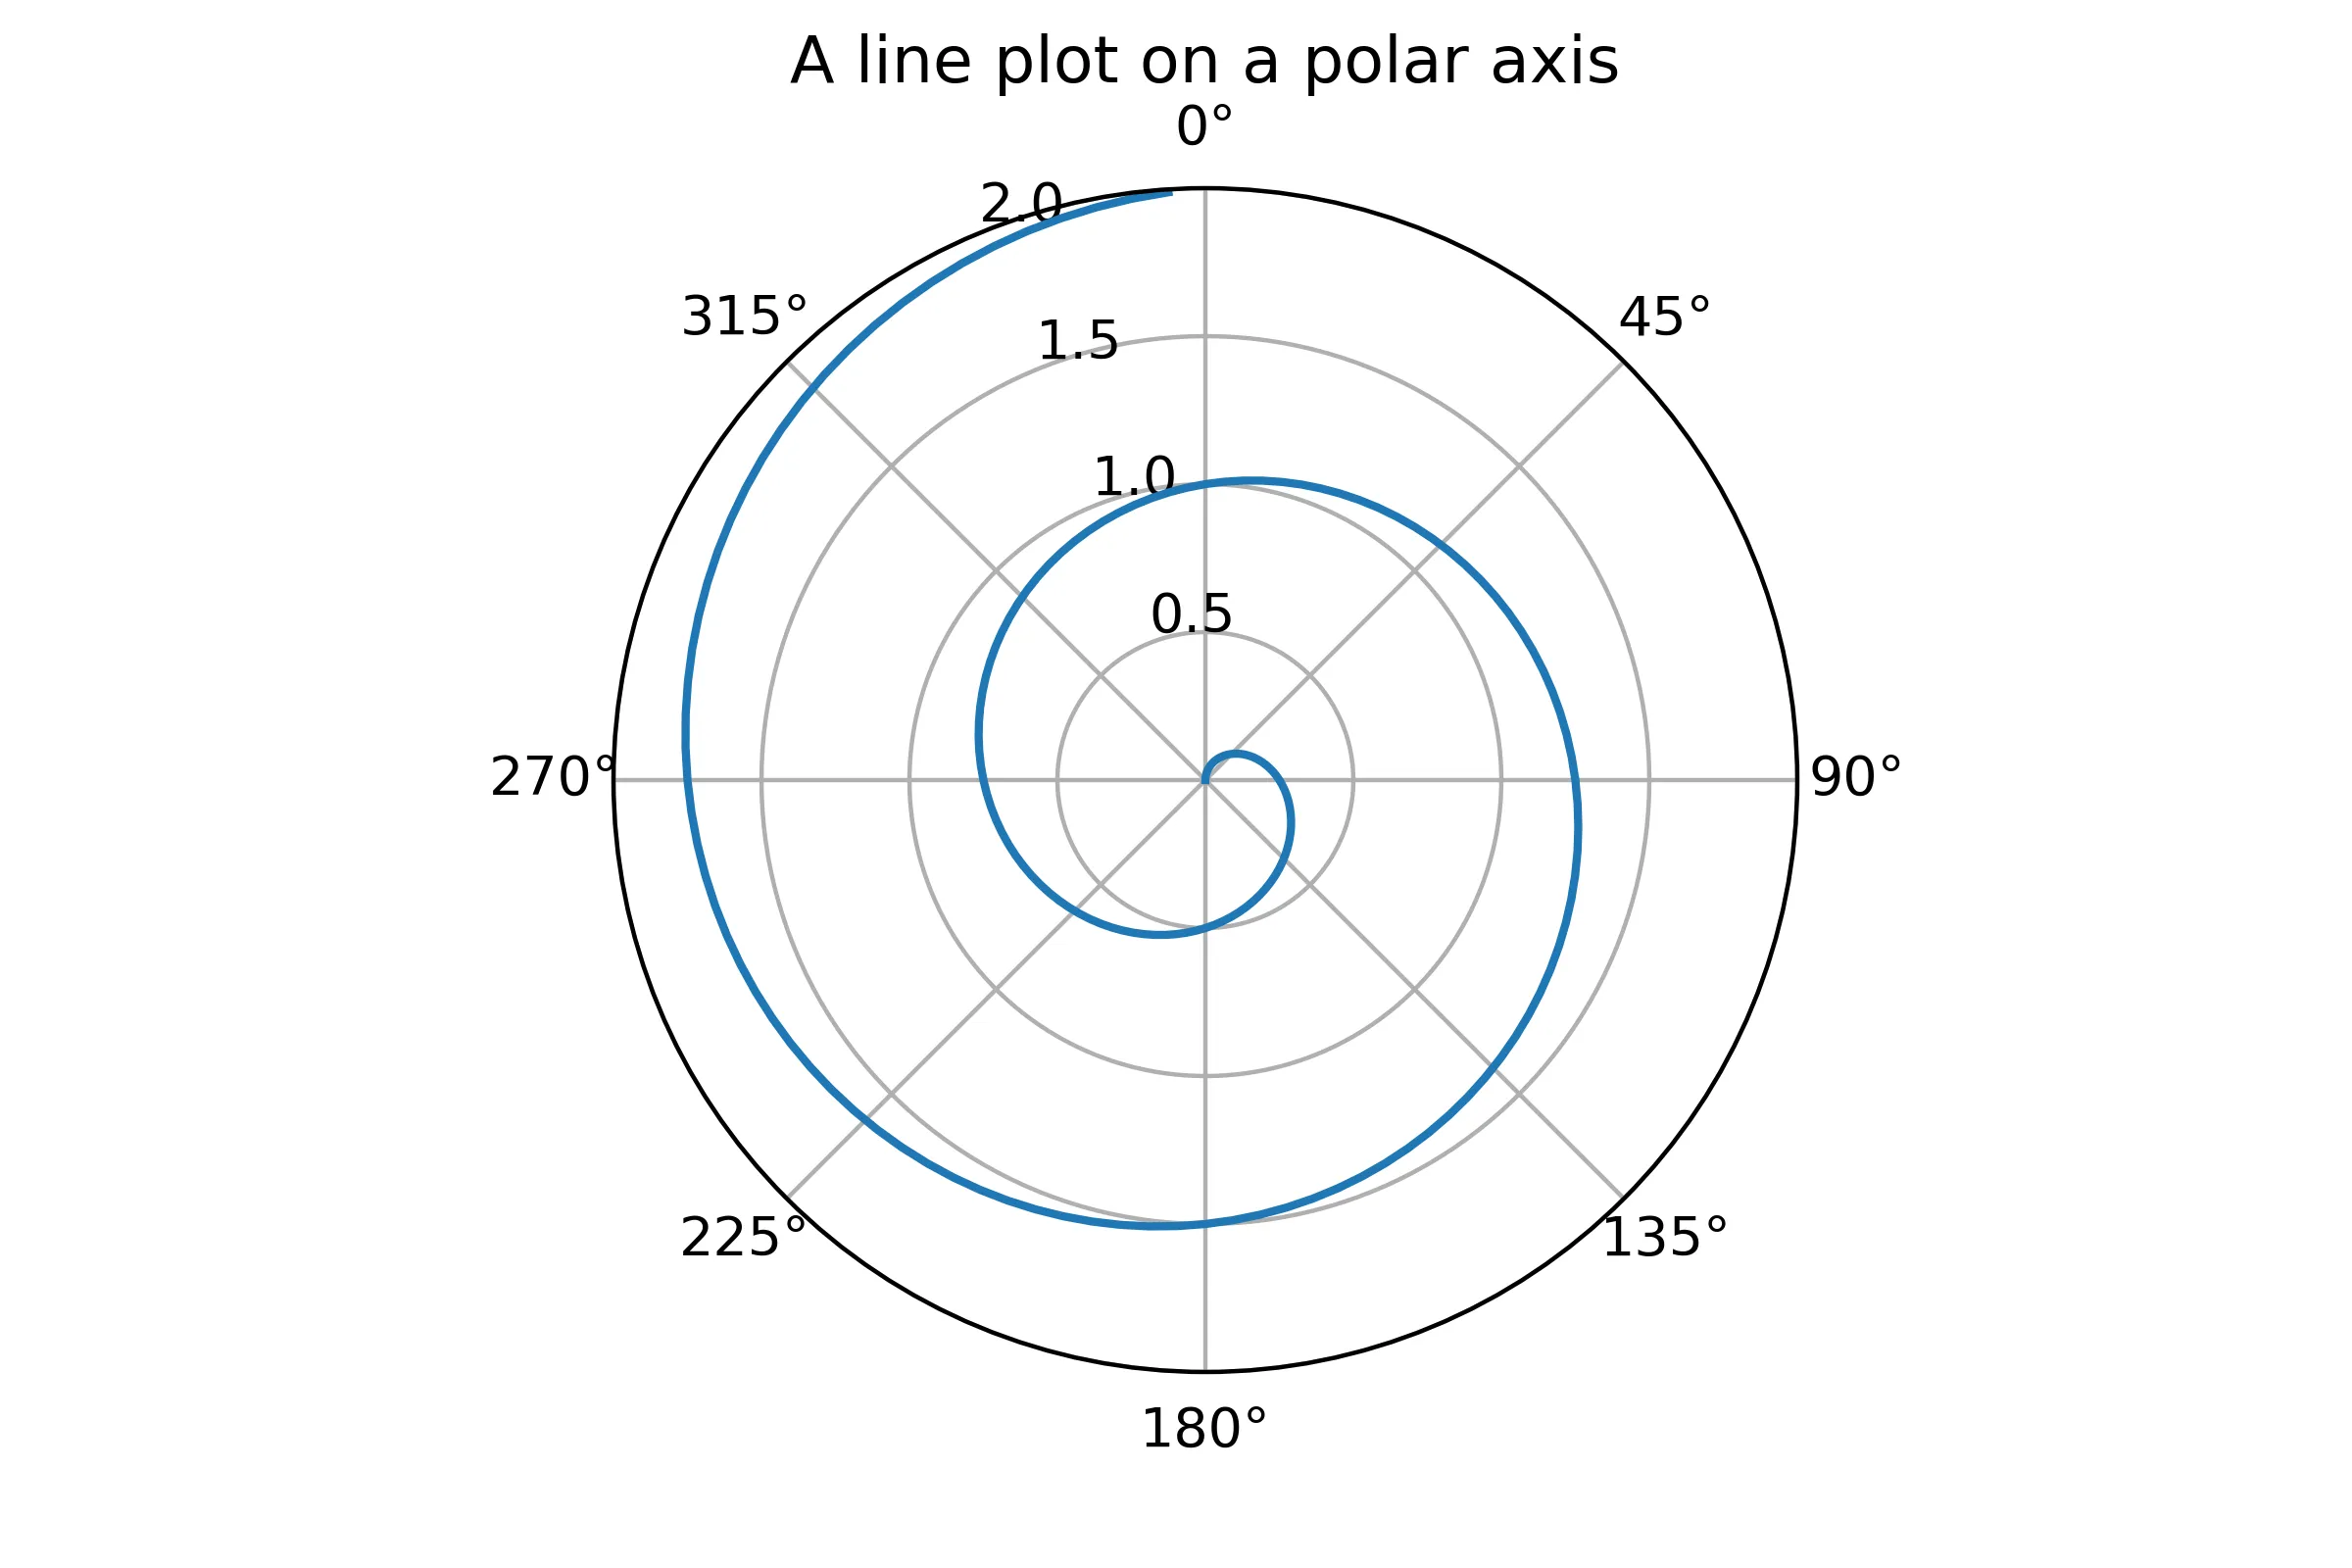
轴方法set_theta_zero_location和set_theta_direction允许您分别指定零位置和增加theta的方向。下面是Matplotlib示例的修改版本。
import numpy as np
import matplotlib.pyplot as plt

r = np.arange(0, 2, 0.01)
theta = 2 * np.pi * r

ax = plt.subplot(111, projection='polar')
ax.plot(theta, r)
ax.set_rmax(2)
ax.set_rticks([0.5, 1, 1.5, 2])  # less radial ticks
ax.set_rlabel_position(-22.5)  # get radial labels away from plotted line
ax.grid(True)

# ---- mod here ---- #
ax.set_theta_zero_location("N")  # theta=0 at the top
ax.set_theta_direction(-1)  # theta increasing clockwise
# ---- mod here ---- #

ax.set_title("A line plot on a polar axis", va='bottom')
plt.show()
请注意,对于箭头图(quiverplot),这些方法目前会产生奇怪的结果(详见GitHub问题)。
- Steven C. Howell
网页内容由stack overflow 提供, 点击上面的可以查看英文原文,
原文链接
原文链接