Matplotlib 中使用极坐标轴实现四倍显示

4

我正在尝试在matplotlib中创建一个四重显示:

enter image description here

但是我无法理解极轴的逻辑。这是我迄今为止尝试过的:

import numpy as np
import matplotlib.pyplot as plt

# radius of each bar 
radii = [10,  15, 20, 25] 

# Value - width 
width = np.pi/ 2 

# angle of each bar 
theta = [0,90,180,270]

ax = plt.subplot(111, polar=True)
bars = ax.bar(theta, radii, width=width)
plt.show()

我不确定我缺少什么,但我只想要四个“相等”的区域彼此接触。我无法让其工作的是

  • 如何“控制”角度?我的意思是让所有四个“滑块”在[0,90], [90,180], [180, 270], [270, 360]中。

  • 我不明白“宽度”对应什么。

2个回答

4

theta 应该是弧度制,而不是角度制。

如果你稍微调整一下代码:

import numpy as np
import matplotlib.pyplot as plt

# radius of each bar
radii = [10,  15, 20, 25]

# Value - width
width = np.pi/ 2

# angle of each bar
theta = np.radians([0,90,180,270])

ax = plt.subplot(111, polar=True)
bars = ax.bar(theta, radii, width=width, alpha=0.5)
plt.show()

您将获得您所期望的:
在这里插入图像描述
另外,对于您正在制作的确切绘图,使用四个楔形片在中心脊线上的矩形图上可能更有意义。

太好了!谢谢。不确定你所说的“4楔子”是什么意思。 - user1043144

2

如果有其他人感兴趣,这是我想出来的方法

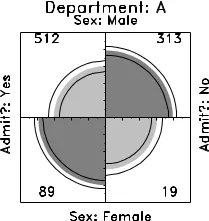
为了使用论文中伯克利入学的例子,首先需要使用迭代比例拟合将值标准化(使边距相等)。

def ContTableIPFP(x1ContTable):
''' poor man IPFP
    compute iterative proportional fitting for 
    a 2 X 2 contingency table
    Input : 
      a 2x2 contingency table as numpy array
    Output : 
       numpy array with values standarized to equate margins
 '''
 import numpy as np 
 #Margins 
 xSumRows = np.sum(x1ContTable, axis = 0).tolist()
 xSumCols = np.sum(x1ContTable, axis = 1).tolist()

 # Seed 
 xq0 = x1ContTable/x1ContTable
 # Iteration 1 : we adjust by row sums (i.e. using the sums of the columns)
 xq1 = np.array([
            (xq0[0] * xSumCols[0]).astype(float) / np.sum(xq0, axis = 0).tolist()[0],
            (xq0[1] * xSumCols[1]).astype(float) / np.sum(xq0, axis = 0).tolist()[1],
           ]
           )
 #Iteration 2 : adjust by columns (i.e. using sums of rows) 
 xq2 = np.array([
            (xq1[:,0] * xSumRows[0]).astype(float) / np.sum(xq1, axis = 0).tolist()[0],
            (xq1[:,1] * xSumRows[1]).astype(float) / np.sum(xq1, axis = 0).tolist()[1],
           ]
           )

 return xq2.T

然后绘制图表

def FourfoldDisplay(radii):
  ''' radii = [10,  15, 20, 25]
   '''
   import numpy as np
   import matplotlib.pyplot as plt

   # Value - width
   width = np.pi/ 2
   # angle of each bar
   theta = np.radians([0,90,180,270])
   ax = plt.subplot(111, polar=True)    
   bars = ax.bar(theta, radii, width=width, alpha=0.5)

   #labels 
   ax.set_xticklabels([])
   ax.set_yticks([])
   #plt.axis('off')

   plt.show()

使用

import numpy as np 
x1 = np.array([
            [1198, 1493], 
            [557, 1278]
            ])

x2 = ContTableIPFP(x1).flatten() 
FourfoldDisplay(x2)

网页内容由stack overflow 提供, 点击上面的
可以查看英文原文,
原文链接