在matplotlib坐标轴中添加+符号的指数

8
我有一个对数-对数图,范围从10^-310^+3。我希望值≥10^0在指数上有一个+符号,类似于值<10^0在指数上有一个-符号。在matplotlib中有一种简单的方法来实现这个吗?
我研究了FuncFormatter,但它似乎过于复杂,而且我也无法让它工作。

你是说你想要像那样格式化x轴和y轴上的刻度标注吗? - tokamak
@tokamak - 目前只对y轴感兴趣,但是单独设置两个轴会很好。 - nluigi
看一下生成刻度标记的代码 https://github.com/matplotlib/matplotlib/blob/7d1a7c2e4637efba239ad3b984928c0175d45f98/lib/matplotlib/ticker.py#L803,似乎没有明显的方法可以自己更改。我猜一个不太理想的方法就是创建一个修改过的版本,更改第823行。 - Simon Gibbons
@SimonGibbons,总有办法改变事物的,你只需要知道在哪里寻找!在这种情况下,OP已经提到了FuncFormatter,这正是我们需要的工具。 - tmdavison
2个回答

6
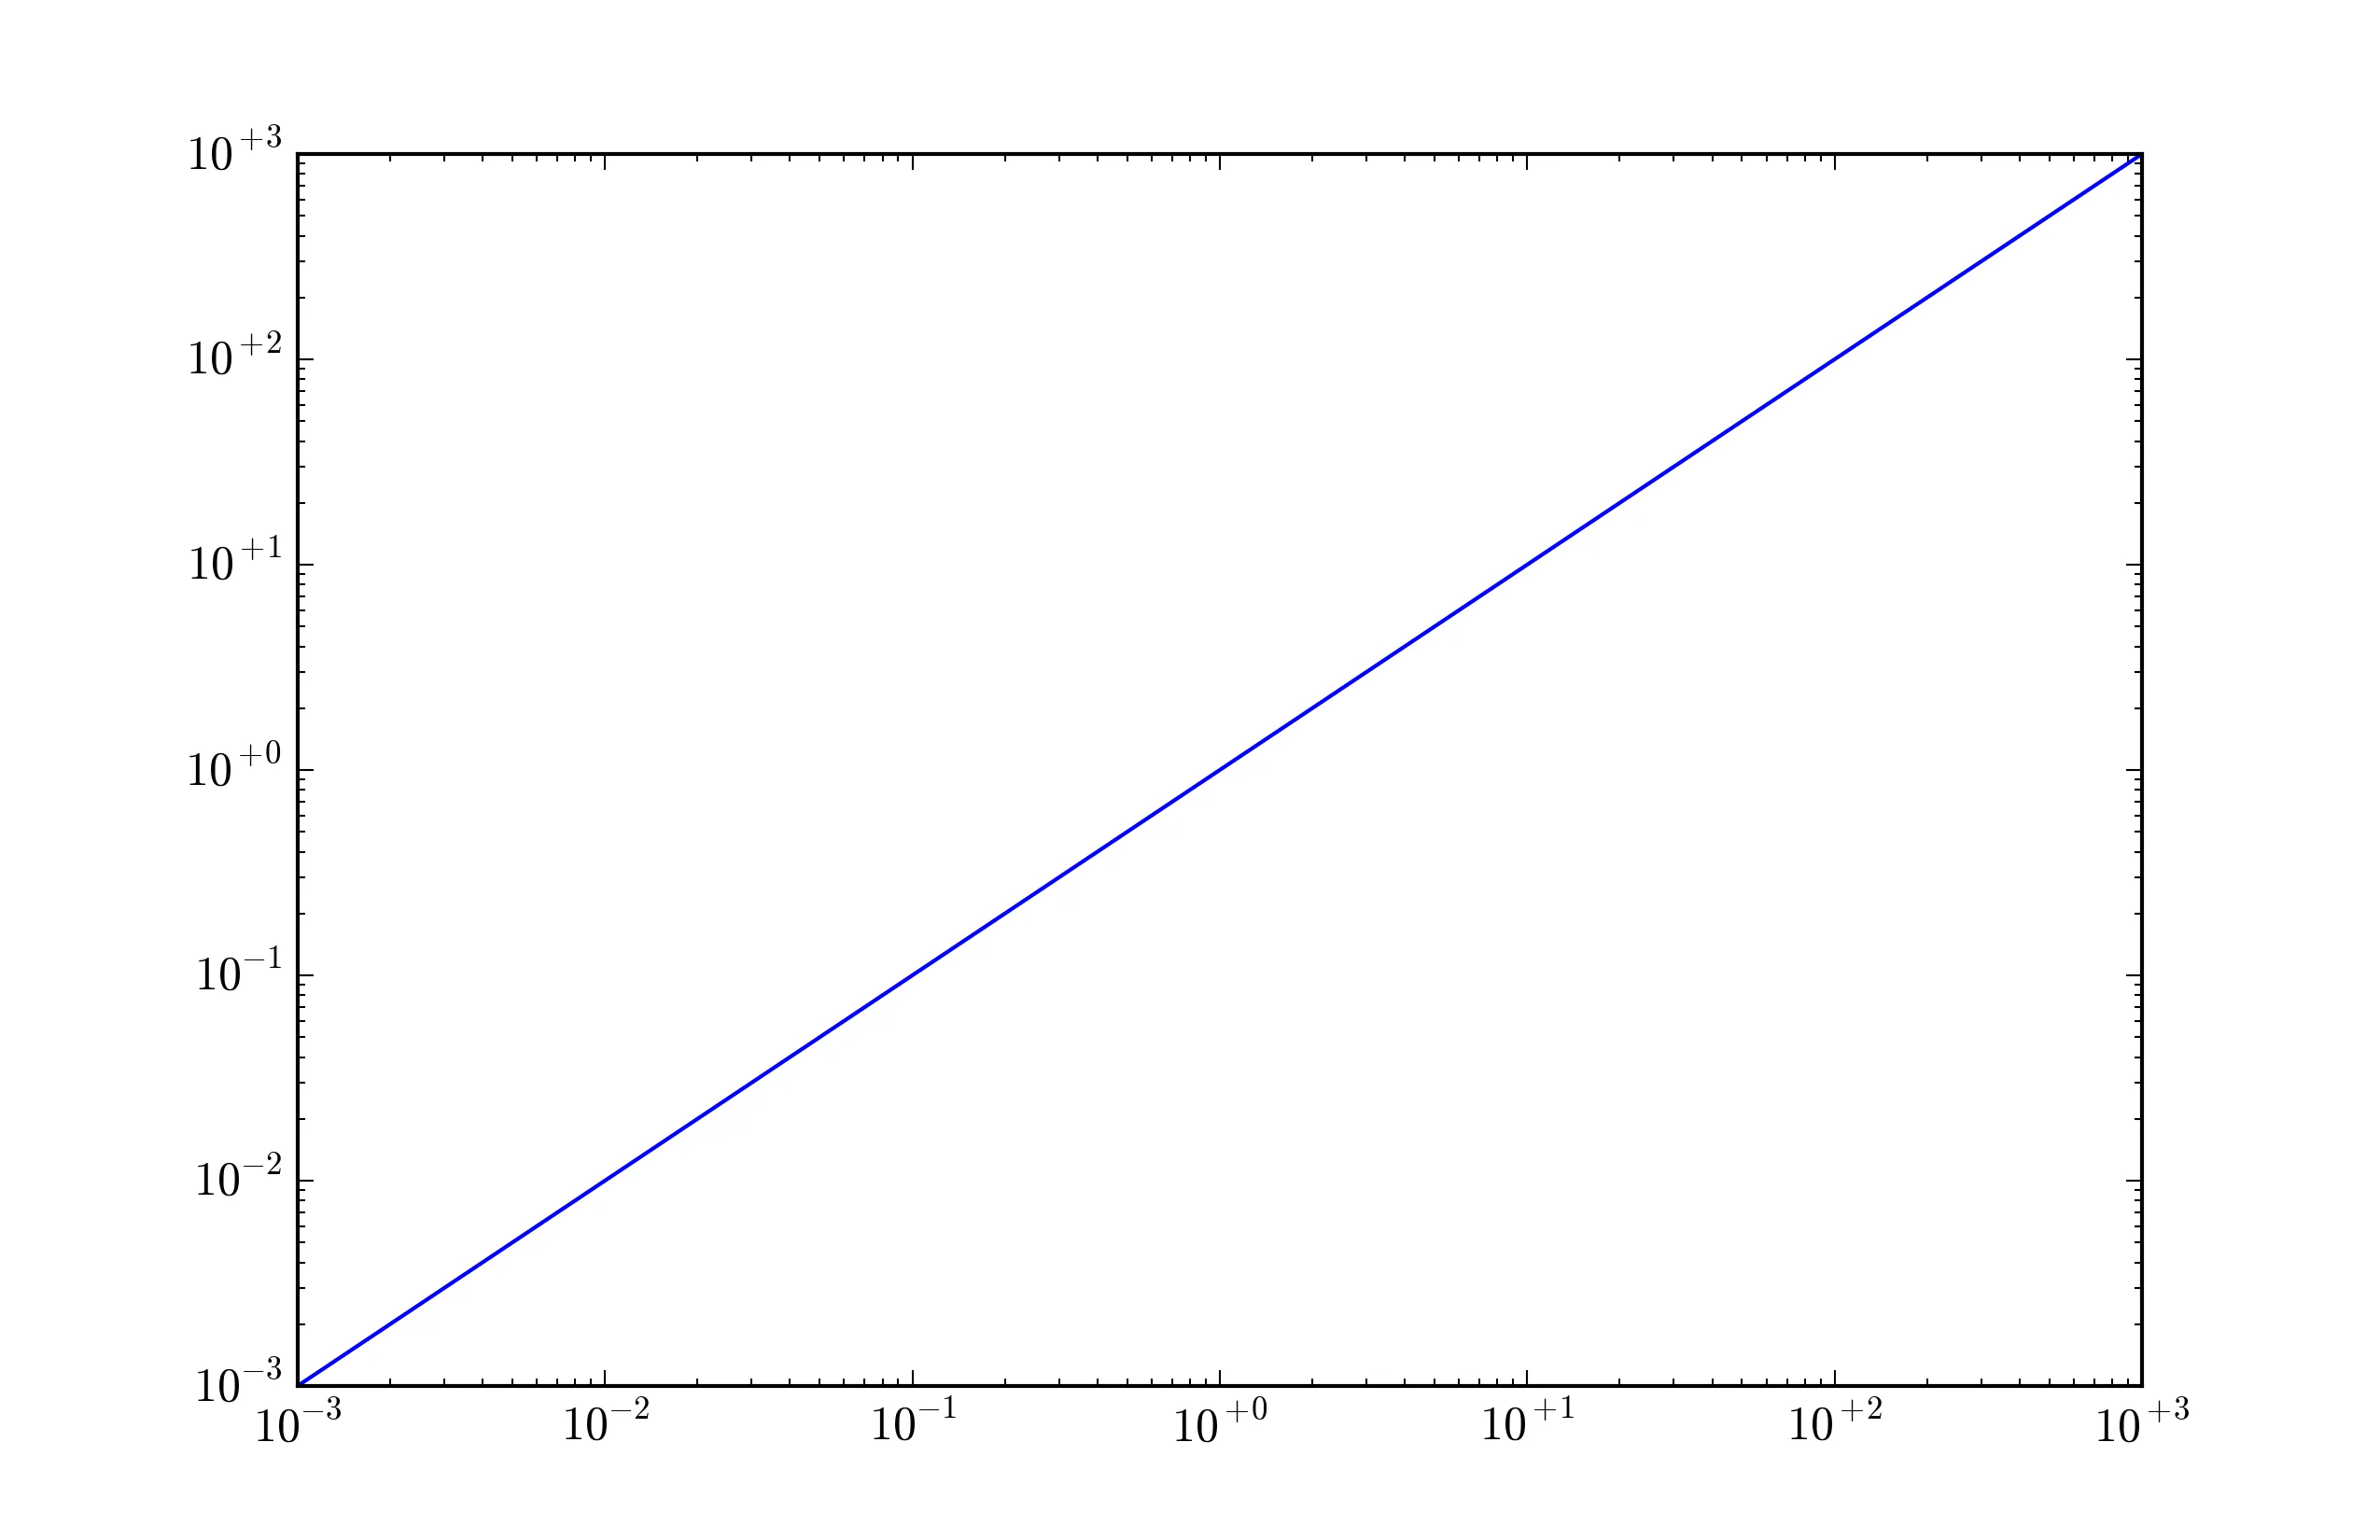
您可以使用来自matplotlib.ticker模块的FuncFormatter实现此操作。您需要根据刻度值是否大于或小于1设置条件。因此,如果log10(tick value)>0,则在标签字符串中添加+符号,否则它将自动获得其减号。
import matplotlib.pyplot as plt
import matplotlib.ticker as ticker
import numpy as np

# sample data
x = y = np.logspace(-3,3)

# create a figure
fig,ax = plt.subplots(1)

# plot sample data
ax.loglog(x,y)

# this is the function the FuncFormatter will use
def mylogfmt(x,pos):
    logx = np.log10(x) # to get the exponent
    if logx < 0:
        # negative sign is added automatically  
        return u"$10^{{{:.0f}}}$".format(logx)
    else:
        # we need to explicitly add the positive sign
        return u"$10^{{+{:.0f}}}$".format(logx)

# Define the formatter
formatter = ticker.FuncFormatter(mylogfmt)

# Set the major_formatter on x and/or y axes here
ax.xaxis.set_major_formatter(formatter)
ax.yaxis.set_major_formatter(formatter)

plt.show()

enter image description here

格式字符串的一些解释:

"$10^{{+{:.0f}}}$".format(logx)

双括号{{}}被传递给LaTeX,表示它们内部的所有内容都应该作为指数上升。我们需要双括号,因为单括号用于包含格式字符串,例如{:.0f}。有关格式规范的更多解释,请参见此处的文档,但对于您的情况,TL;DR是我们正在使用精度为0的浮点数格式化浮点数(即将其基本上打印为整数);在这种情况下,指数是浮点数,因为np.log10返回一个浮点数。(或者可以将np.log10的输出转换为int,然后将字符串格式化为int-只是您偏好哪个)。

好的,谢谢。我会用这个...你能解释一下 {{:.0f}} 的格式吗?我猜多余的大括号是用来转义的,但是 :.0f 到底是什么意思呢? - nluigi

0

我希望这就是你的意思:

def fmt(y, pos):
    a, b = '{:.2e}'.format(y).split('e')
    b = int(b)
    if b >= 0:
      format_example = r'$10^{+{}}$'.format(b)
    else:
      format_example = r'$10^{{}}$'.format(b)
    return

然后使用 FuncFormatter,例如对于一个 colorbar: plt.colorbar(name_of_plot,ticks=list_with_tick_locations, format = ticker.FuncFormatter(fmt))。我认为您需要导入 import matplotlib.ticker as ticker
敬礼

网页内容由stack overflow 提供, 点击上面的
可以查看英文原文,
原文链接