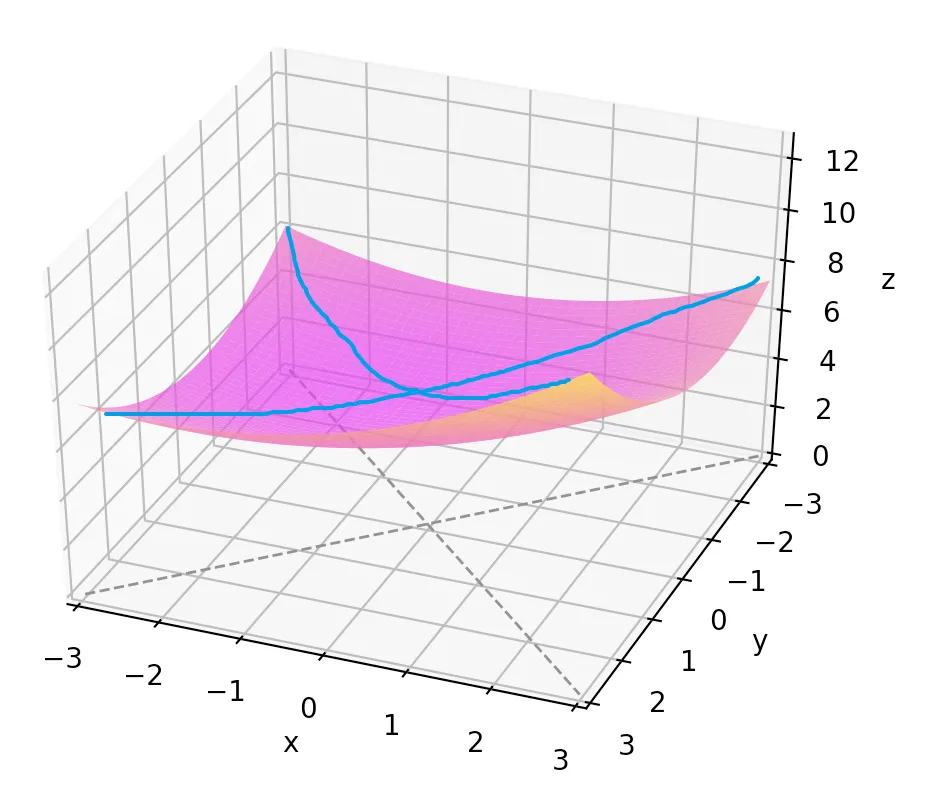
我想在一个表面上(粉色表面)画两条线来代表这个粉色表面的两条切割线和两个二维平面(x = y 和 x = -y),就像下面图片中的蓝色线一样。有人知道如何做吗?
import numpy as NP
import matplotlib.pyplot as PLT

def f(x1, x2):
    return 0.5 * x1 + 0.6 * x2 + 0.2 * x1 * x1 + 0.1 * x1 * x2 + 0.3 * x2 * x2 + 4

x = NP.linspace(-3, 3, 100)
y = NP.linspace(-3, 3, 100)
xx, yy = NP.meshgrid(x,y)
z = f(xx, yy)

# set up the figure
fig = PLT.figure()
ax = fig.gca(projection='3d')
ax.set_xlim(-3, 3)
ax.set_ylim(3, -3)
ax.set_xlabel("x")
ax.set_ylabel("y")
ax.set_zlabel("z")

# plot the figure
ax.plot_surface(xx, yy, z, cmap="spring", alpha = 0.7)

# add the x=y line to the ground plane
ax.plot([-3, 3], [-3, 3], color = 'grey', linewidth = 1, linestyle='dashed')

# add the x=-y line to the ground plane
ax.plot([3, -3], [-3, 3], color = 'grey', linewidth = 1, linestyle='dashed')

PLT.show()
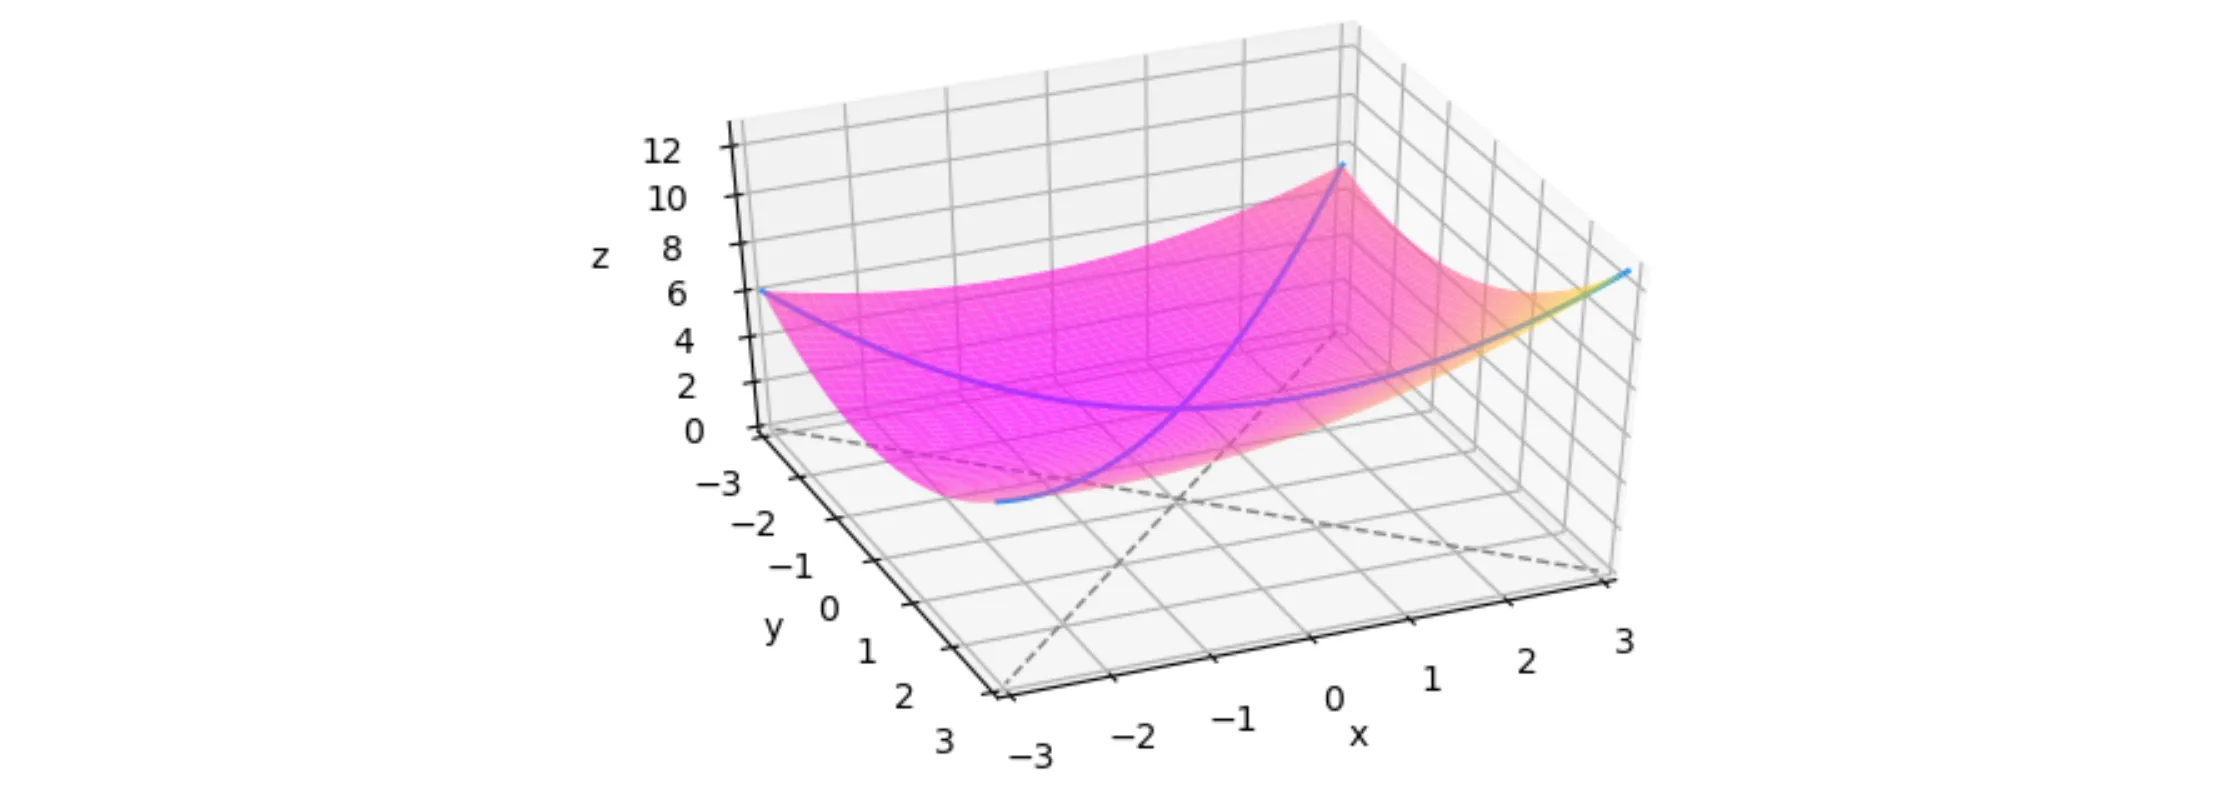
x,y和x,-y,并将y轴标记为z,以便与3D图表保持一致。 - JohanC