如何绘制混淆矩阵?

158

我正在使用scikit-learn对22000个文本文档进行100类别的分类。我使用了scikit-learn的混淆矩阵方法来计算混淆矩阵。

model1 = LogisticRegression()
model1 = model1.fit(matrix, labels)
pred = model1.predict(test_matrix)
cm=metrics.confusion_matrix(test_labels,pred)
print(cm)
plt.imshow(cm, cmap='binary')
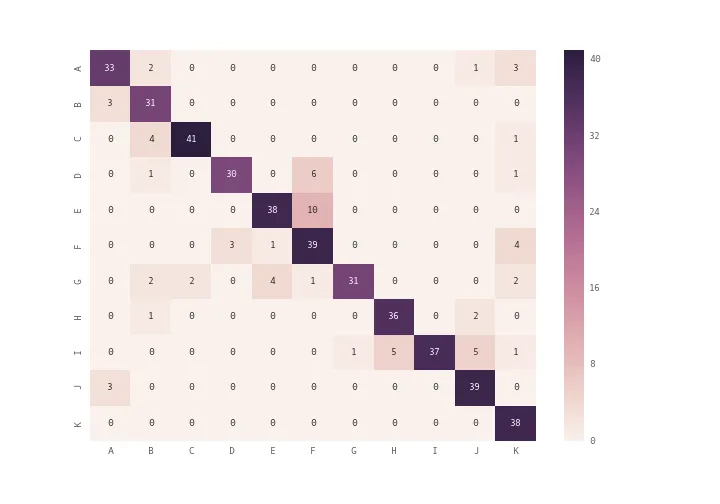
这是我的混淆矩阵:

[[3962  325    0 ...,    0    0    0]
 [ 250 2765    0 ...,    0    0    0]
 [   2    8   17 ...,    0    0    0]
 ..., 
 [   1    6    0 ...,    5    0    0]
 [   1    1    0 ...,    0    0    0]
 [   9    0    0 ...,    0    0    9]]

然而,我没有得到一个清晰或易读的情节。有没有更好的方法来做到这一点?


请查看此答案,其中包含纯Matplotlib代码:https://dev59.com/QG025IYBdhLWcg3wvIu2#74152927 - SomethingSomething
3个回答

234

输入图像描述

你可以使用plt.matshow()代替plt.imshow(),或者你可以使用 seaborn 模块的 heatmap查看文档)来绘制混淆矩阵。

import seaborn as sn
import pandas as pd
import matplotlib.pyplot as plt
array = [[33,2,0,0,0,0,0,0,0,1,3], 
        [3,31,0,0,0,0,0,0,0,0,0], 
        [0,4,41,0,0,0,0,0,0,0,1], 
        [0,1,0,30,0,6,0,0,0,0,1], 
        [0,0,0,0,38,10,0,0,0,0,0], 
        [0,0,0,3,1,39,0,0,0,0,4], 
        [0,2,2,0,4,1,31,0,0,0,2],
        [0,1,0,0,0,0,0,36,0,2,0], 
        [0,0,0,0,0,0,1,5,37,5,1], 
        [3,0,0,0,0,0,0,0,0,39,0], 
        [0,0,0,0,0,0,0,0,0,0,38]]
df_cm = pd.DataFrame(array, index = [i for i in "ABCDEFGHIJK"],
                  columns = [i for i in "ABCDEFGHIJK"])
plt.figure(figsize = (10,7))
sn.heatmap(df_cm, annot=True)

1
mask_bad = X.mask if np.ma.is_masked(X) else np.isnan(X) # Mask nan's. TypeError: 输入类型不支持ufunc 'isnan',根据强制转换规则“safe”,输入无法安全地强制转换为任何支持的类型。 - Gulzar
如果有三位或更多位的数字,它会以正常形式打印,例如对于340,会打印为3.4e+02,这是由于默认的fmt参数。将其设置为类似于sn.heatmap(df_cm, annot=True, fmt='.10g')可以解决这个问题。 - undefined

123

@bninopaul的回答并不完全适合初学者

以下是你可以“复制并运行”的代码

import seaborn as sn
import pandas as pd
import matplotlib.pyplot as plt

array = [[13,1,1,0,2,0],
         [3,9,6,0,1,0],
         [0,0,16,2,0,0],
         [0,0,0,13,0,0],
         [0,0,0,0,15,0],
         [0,0,1,0,0,15]]

df_cm = pd.DataFrame(array, range(6), range(6))
# plt.figure(figsize=(10,7))
sn.set(font_scale=1.4) # for label size
sn.heatmap(df_cm, annot=True, annot_kws={"size": 16}) # font size

plt.show()

result


6
补充一点,如果需要自定义 xy 标签,请将 df_cm 行替换为以下内容:df_cm = pd.DataFrame(array, index=["阶段1", "阶段2", "阶段3", "阶段4"], columns=["阶段1", "阶段2", "阶段3", "阶段4"])。请注意,这不会改变原文的意思。 - Arun Das
31
我不明白这个答案为什么更适合“初学者”?它基本上和bninopaul的回答一样。 - David Skarbrevik
4
混淆矩阵是“初学者级别的”。@DavidSkarbrevik ;) - n1k31t4

77

如果您想要在混淆矩阵中包含“总列”和“总行”的更多数据,以及每个单元格中的百分比(%),类似于Matlab默认情况下的方式(见下图),请使用{{ }}占位符。

enter image description here

包括热力图和其他选项...

你应该享受上面的模块,在Github上分享;)

https://github.com/wcipriano/pretty-print-confusion-matrix


这个模块可以轻松完成您的任务,并使用许多参数生成上面的输出,以自定义您的CM:enter image description here


嗨,谢谢您!您能批准这个PR吗?使用pip安装会更加方便:https://github.com/wcipriano/pretty-print-confusion-matrix/pull/11 - Ian
1
你好 Ian!好的,我会检查并批准你的 PR,感谢合作 ; ) - Wagner Cipriano
不是我的PR,但感谢您的批准! :) - Ian
1
好的,这是PR 11(使软件包可通过PyPI安装)。 我在这个帖子中看到了你的评论,谢谢! - Wagner Cipriano

网页内容由stack overflow 提供, 点击上面的
可以查看英文原文,
原文链接