在stackoverflow上,像1、2和3这样的问题中,混淆矩阵通常是使用颜色来表示的。
但在我的情况下,我不想使用颜色,特别是因为我的数据集往往存在严重的类别不平衡,少数类总是用浅颜色显示。我希望它能够显示每个单元格中实际/预测数量的数字,而不是使用颜色。
目前,我使用以下代码:
def plot_confusion_matrix(cm, classes, title,
                          normalize=False,
                          file='confusion_matrix',
                          cmap=plt.cm.Blues):

    if normalize:
        cm = cm.astype('float') / cm.sum(axis=1)[:, np.newaxis]
        cm_title = "Normalized confusion matrix"
    else:
        cm_title = title

    # print(cm)

    plt.imshow(cm, interpolation='nearest', cmap=cmap)
    plt.title(cm_title)
    plt.colorbar()
    tick_marks = np.arange(len(classes))
    plt.xticks(tick_marks, classes, rotation=45)
    plt.yticks(tick_marks, classes)

    fmt = '.3f' if normalize else 'd'
    thresh = cm.max() / 2.
    for i, j in itertools.product(range(cm.shape[0]), range(cm.shape[1])):
        plt.text(j, i, format(cm[i, j], fmt),
                 horizontalalignment="center",
                 color="white" if cm[i, j] > thresh else "black")

    plt.tight_layout()
    plt.ylabel('True class')
    plt.xlabel('Predicted class')
    plt.tight_layout()
    plt.savefig(file + '.png')
输出结果:
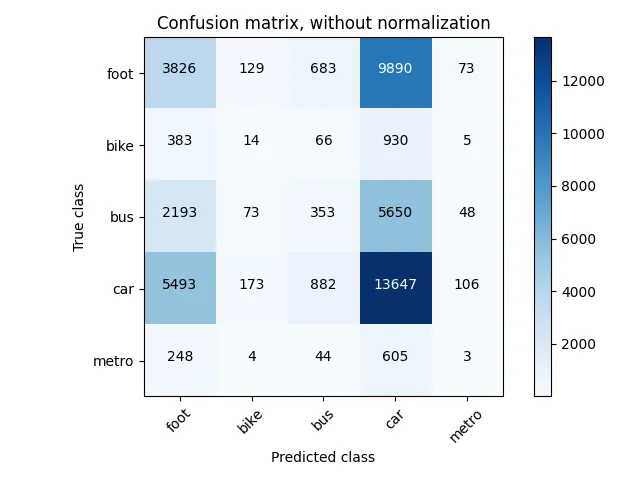
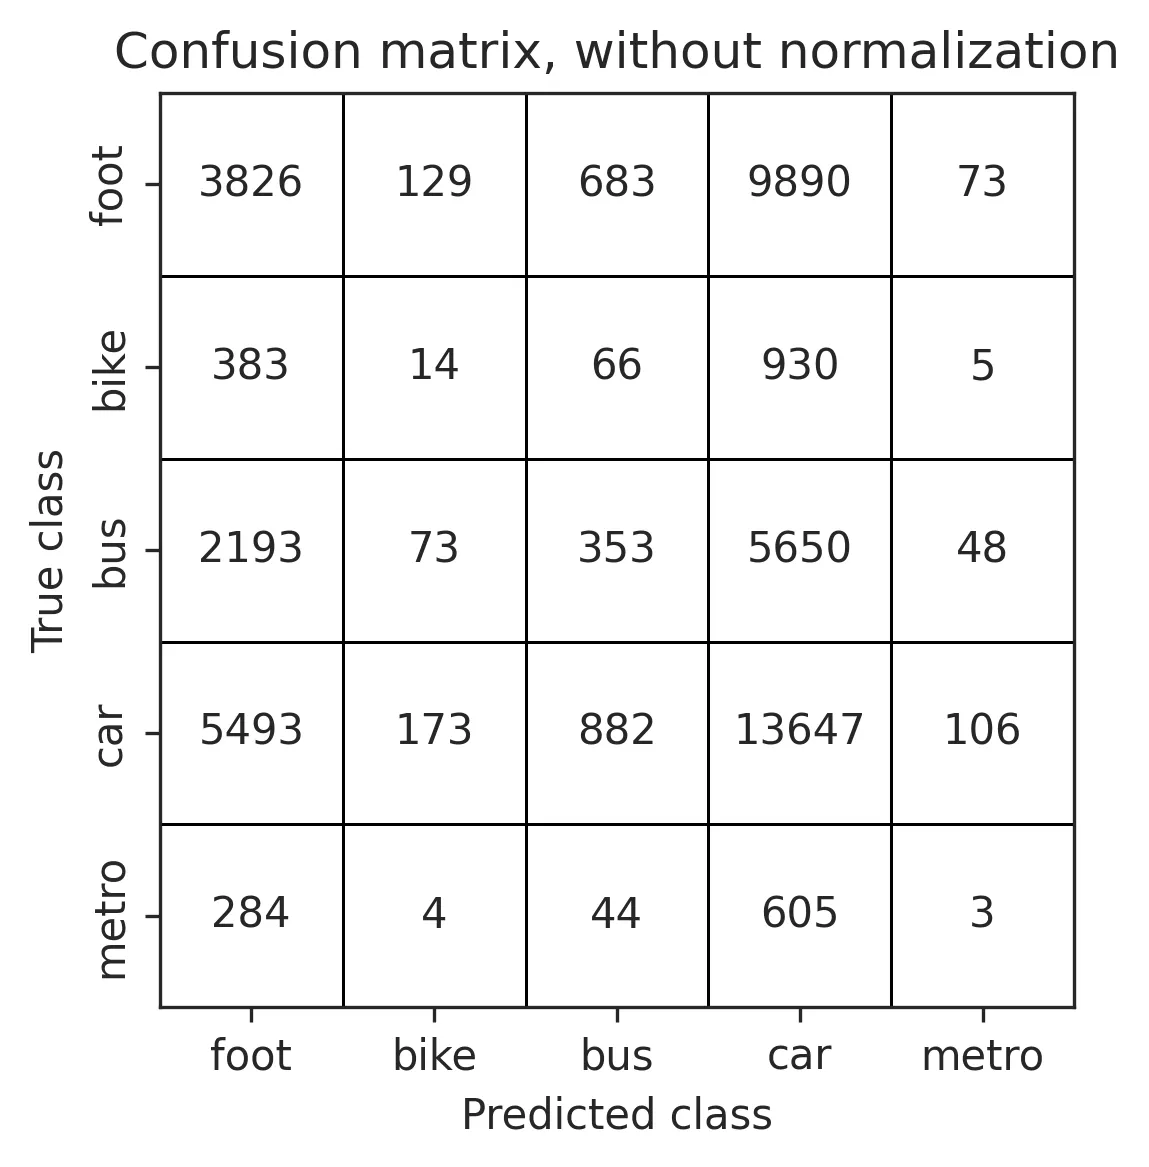
所以我只想显示数字。
cmap处有一个括号问题。 - tumultous_roosterSyntaxError: unmatched ')'- tumultous_rooster