我试图使用 plot_confusion_matrix 函数,
from sklearn.metrics import confusion_matrix

y_true = [1, 1, 0, 1]
y_pred = [1, 1, 0, 0]

confusion_matrix(y_true, y_pred)
输出:
array([[1, 0],
       [1, 2]])
现在,使用以下内容时,可以使用“类”或不使用“类”
from sklearn.metrics import plot_confusion_matrix

plot_confusion_matrix(y_true, y_pred, classes=[0,1], title='Confusion matrix, without normalization')
或者
plot_confusion_matrix(y_true, y_pred, title='Confusion matrix, without normalization')
我希望我能得到类似于这个图像的输出结果,除了里面的数字以外。
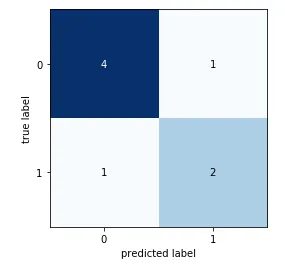
绘制简单的图表不应该需要估算器。
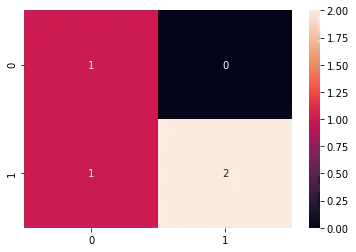
使用mlxtend.plotting,
from mlxtend.plotting import plot_confusion_matrix
import matplotlib.pyplot as plt
import numpy as np

binary1 = np.array([[4, 1],
                   [1, 2]])

fig, ax = plot_confusion_matrix(conf_mat=binary1)
plt.show()
它提供相同的输出。
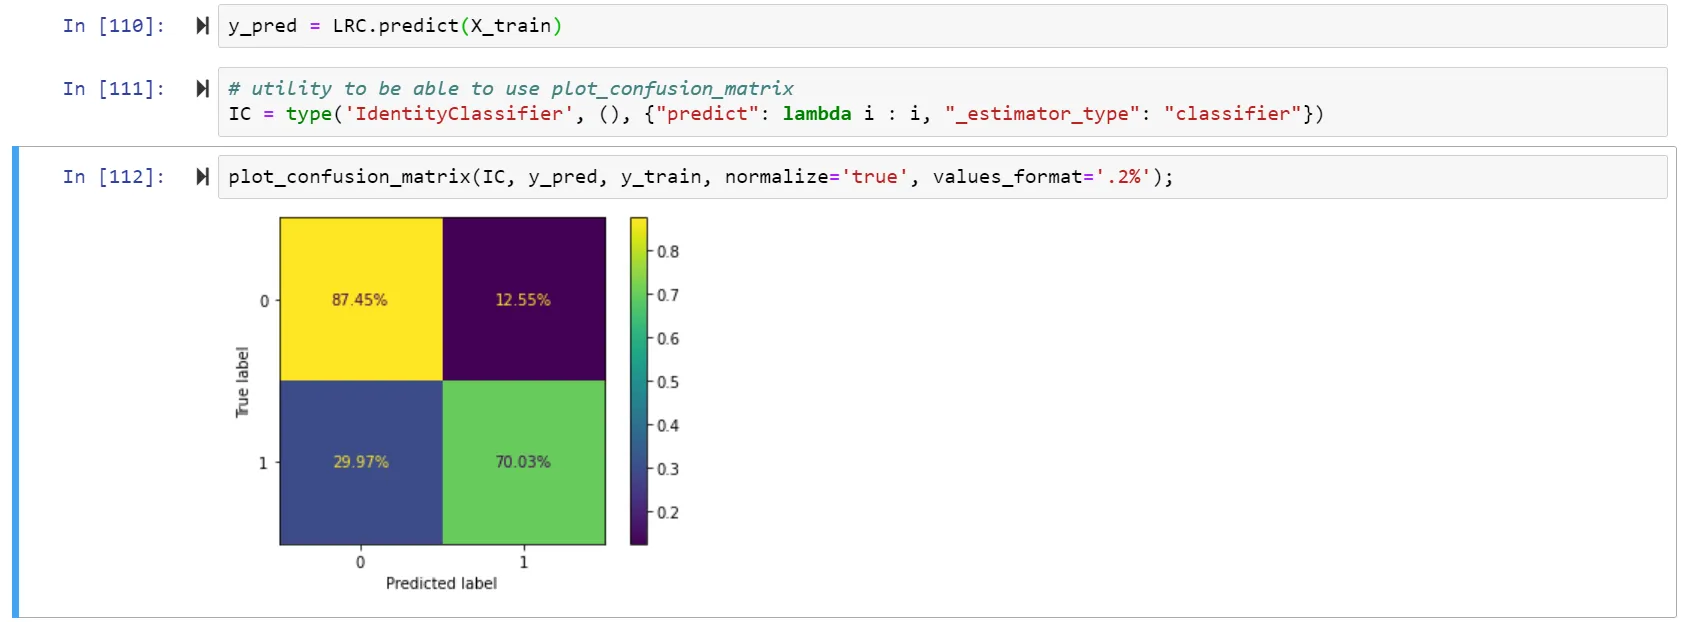
根据这个
它需要一个分类器,
disp = plot_confusion_matrix(classifier, X_test, y_test,
                                 display_labels=class_names,
                                 cmap=plt.cm.Blues,
                                 normalize=normalize)
我可以不使用分类器来绘制它吗?