创建一个流程热力图。

5
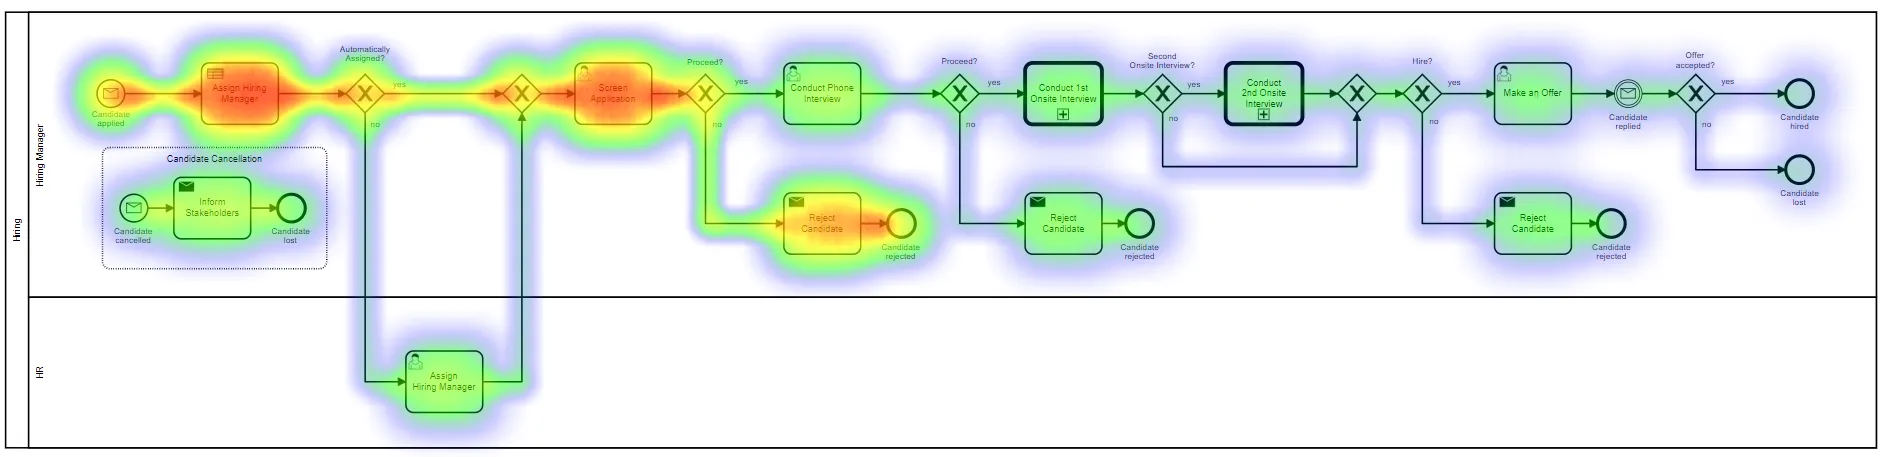
我有一个问题。我想创建一个具有热力图的流程,以查看每个步骤所需的时间。 我使用PyDot创建了流程,并为每个步骤创建了一个dataframe
我该如何为我的流程创建一个热力图?
计算还应包括从一个步骤到另一个步骤的时间。 因此,您可以计算边缘时间,例如 task1_start - start / task2_start - task1_end, 以及节点时间,例如 task1_end - task1_start / task2_end - task2_start
我的MVP只会更改边框的颜色。但我想创建一个真正的热力图。

enter image description here

进程

import pydot
from IPython.display import SVG

graph = pydot.Dot(graph_type='digraph')

task_node1 = pydot.Node("Task1", shape="box",)
task_node2 = pydot.Node("Task2", shape="box",)


graph.add_node(task_node1)
graph.add_node(task_node2)


task1_to_task2_edge = pydot.Edge("Task1", "Task2",)


graph.add_edge(task1_to_task2_edge)


graph.write_svg("diagram.svg")
SVG('diagram.svg')

enter image description here

Dataframe


   id         step   timestamp
0   1  task1_start  2023-01-01
1   1    task1_End  2023-01-05
2   1  task2_start  2023-01-10
3   1    task2_end  2023-01-12
4   2  task1_start  2023-01-01
5   2    task1_End  2023-01-05
6   2  task2_start  2023-01-10
7   2    task2_end  2023-01-12
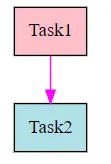
MVP

import pandas as pd 
d = {'id': [1, 1, 1, 1,
            2, 2, 2, 2,],
    'step': ['task1_start', 'task1_End', 'task2_start', 'task2_end',
              'task1_start', 'task1_End', 'task2_start', 'task2_end',],
     'timestamp': ['2023-01-01', '2023-01-05', '2023-01-10', '2023-01-12',
               '2023-01-01', '2023-01-05', '2023-01-10', '2023-01-12',]}

df  = pd.DataFrame(data=d,)

df['timestamp'] = pd.to_datetime(df['timestamp'])

g = df.groupby('id')

out = (df
    .assign(duration=df['timestamp'].sub(g['timestamp'].shift()),
            step=lambda d: (df['step']+'/'+g['step'].shift()).str.replace(
                 r'([^_]+)[^/]*/([^_]+)[^/]*',
                 lambda m: m.group(1) if m.group(1)==m.group(2) else f"{m.group(2)}_to_{m.group(1)}",
                 regex=True)
           )
   [['id', 'step', 'duration']].dropna(subset=['duration'])
)

df = out

import pandas as pd
import matplotlib.pyplot as plt
import matplotlib.colors as mcolors


colors = mcolors.LinearSegmentedColormap.from_list(
    'LightBlueGreenYellowRed', ['#B0E0E6', '#87CEEB', '#00FF00', '#ADFF2F', '#FFFF00', '#FFD700', '#FFA500', '#FF4500', '#FF0000', '#FF6347', '#FF7F50', '#FFA07A', '#FFC0CB', '#FFB6C1', '#FF69B4', '#DB7093', '#FF1493', '#C71585', '#FF00FF']
)

def get_color(value, vmin, vmax):
    norm = (value - vmin) / (vmax - vmin)
    cmap = colors(norm)
    return mcolors.to_hex(cmap)

vmin = df['duration'].min()
vmax = df['duration'].max()
df['color'] = df['duration'].apply(lambda x: get_color(x, vmin, vmax))

def get_color(id):
    if (df['step'] == id).any():
        color = df.loc[df['step'] == id, 'color'].values[0]
        if pd.isnull(color):
            return '#808080' 
        else:
            return color
    else:
        return '#808080'  
import pydot
from IPython.display import SVG

graph = pydot.Dot(graph_type='digraph')

task_node1 = pydot.Node("Task1", shape="box", color = get_color('task1'))
task_node2 = pydot.Node("Task2", shape="box", color = get_color('task2'))


graph.add_node(task_node1)
graph.add_node(task_node2)


task1_to_task2_edge = pydot.Edge("Task1", "Task2", color = get_color('task1_to_task2'))


graph.add_edge(task1_to_task2_edge)


graph.write_svg("diagram.svg")
SVG('diagram.svg')

enter image description here


你需要帮助计算时间还是绘制热力图? - Corralien
@Corralien 绘制热力图的图形。 - Test
2个回答

0

绘制热力图时,请使用SVG导出并向节点添加类名以标记它们的热度。然后,您可以将该SVG组包含两次,并使用过滤器来创建类似于热力图的效果,即具有填充颜色和模糊背景以及前景中的正常黑白版本。

<svg height="110" width="110" xmlns="http://www.w3.org/2000/svg">

    <style>
        .foreground *{
        fill: none;
        stroke: black;
        }
        .foreground text{
        fill: black;
        stroke: none;
        }
        .background *{
        stroke: none;
        }

        .background text { display: none; }
        .background .heat-1 { fill: #00ff00; }
        .background *.heat-2 { fill: #ff0000; }
    </style>


    <defs>
        <filter id="f1" x="0" y="0">
            <feGaussianBlur in="SourceGraphic" stdDeviation="15" />
        </filter>

    </defs>
    <g transform="scale(1 1) rotate(0) translate(4 112)">
        <g class='background' filter='url(#f1)'>

            <g id="graph0" class="graph">
                <!-- a -->
                <g id="node1" class="node heat-1">
                    <title>a</title>
                    <ellipse cx="27" cy="-90" rx="27" ry="18" />
                    <text text-anchor="middle" x="27" y="-86.3" font-family="Times,serif"
                        font-size="14.00">a</text>
                </g>
                <!-- b -->
                <g id="node2" class="node heat-2">
                    <title>b</title>
                    <ellipse cx="27" cy="-18" rx="27" ry="18" />
                    <text text-anchor="middle" x="27" y="-14.3" font-family="Times,serif"
                        font-size="14.00">b</text>
                </g>
                <!-- a&#45;&gt;b -->
                <g id="edge1" class="edge">
                    <title>a&#45;&gt;b</title>
                    <path d="M27,-71.7C27,-63.98 27,-54.71 27,-46.11" />
                    <polygon fill="black" stroke="black"
                        points="30.5,-46.1 27,-36.1 23.5,-46.1 30.5,-46.1" />
                </g>
            </g>
        </g>
        <g class='foreground'>

            <g id="graph0" class="graph" >
                <!-- a -->
                <g id="node1" class="node heat-1">
                    <title>a</title>
                    <ellipse cx="27" cy="-90" rx="27" ry="18" />
                    <text text-anchor="middle" x="27" y="-86.3" font-family="Times,serif"
                        font-size="14.00">a</text>
                </g>
                <!-- b -->
                <g id="node2" class="node heat-2">
                    <title>b</title>
                    <ellipse cx="27" cy="-18" rx="27" ry="18" />
                    <text text-anchor="middle" x="27" y="-14.3" font-family="Times,serif"
                        font-size="14.00">b</text>
                </g>
                <!-- a&#45;&gt;b -->
                <g id="edge1" class="edge">
                    <title>a&#45;&gt;b</title>
                    <path d="M27,-71.7C27,-63.98 27,-54.71 27,-46.11" />
                    <polygon fill="black" stroke="black"
                        points="30.5,-46.1 27,-36.1 23.5,-46.1 30.5,-46.1" />
                </g>
            </g>
        </g>
    </g>
</svg>

如果您可以两次使用图形组的引用而不是两次包含它,那将非常好,但我无法使用CSS表达式使组在使用时与内联不同。


0
你所需要做的就是使用两个属性:fillcolorstyle='filled'
task_node1 = pydot.Node("Task1", shape="box", fillcolor = get_color('task1'), style='filled')
task_node2 = pydot.Node("Task2", shape="box", fillcolor = get_color('task2'), style='filled')

你可以看一下这个小例子在那里

这是结果:

enter image description here


网页内容由stack overflow 提供, 点击上面的
可以查看英文原文,
原文链接