我正在尝试使用scipy编写一个简单的低通滤波器,但我需要帮助定义参数。
我的时间序列数据中有350万条记录需要过滤,并且数据以1000赫兹的采样率进行采样。
我正在使用scipy库中的signal.firwin和signal.lfilter。
我在下面的代码中选择的参数根本没有过滤我的数据。相反,以下代码只是产生了与相同完全数据相同的图形,除了时间相位失真使图形向右移动了略少于1000个数据点(1秒)。
在另一个软件程序中,通过图形用户界面命令运行低通滤波器会产生类似于每个10秒钟(10000个数据点)段落的均值相似的输出,但是标准偏差要低得多,因此我们基本上会丢失这个特定数据文件中的噪声,并用保留平均值的东西来替换它,同时显示不受更高频率噪声污染的长期趋势。另一个软件的参数对话框包含一个复选框,可以让您选择系数的数量,以便“基于样本大小和采样频率进行优化”。 (我的样本是以1000赫兹采集的350万个样本,但我希望使用这些输入作为变量的函数。)
*是否有任何人可以向我展示如何调整以下代码,以便删除所有高于0.05赫兹的频率?* 我想在图形中看到平滑的波浪,而不只是我现在从下面的代码中获得的相同完全图形的时间失真。
class FilterTheZ0():
    def __init__(self,ZSmoothedPylab):
        #------------------------------------------------------
        # Set the order and cutoff of the filter
        #------------------------------------------------------
        self.n = 1000
        self.ZSmoothedPylab=ZSmoothedPylab
        self.l = len(ZSmoothedPylab)
        self.x = arange(0,self.l)
        self.cutoffFreq = 0.05

        #------------------------------------------------------
        # Run the filter
        #------------------------------------------------------
        self.RunLowPassFIR_Filter(self.ZSmoothedPylab, self.n, self.l
                                       , self.x, self.cutoffFreq)

    def RunLowPassFIR_Filter(self,data, order, l, x, cutoffFreq):
        #------------------------------------------------------
        # Set a to be the denominator coefficient vector
        #------------------------------------------------------
        a = 1
        #----------------------------------------------------
        # Create the low pass FIR filter
        #----------------------------------------------------
        b = signal.firwin(self.n, cutoff = self.cutoffFreq, window = "hamming")

        #---------------------------------------------------
        # Run the same data set through each of the various
        # filters that were created above.
        #---------------------------------------------------
        response = signal.lfilter(b,a,data)
        responsePylab=p.array(response)

        #--------------------------------------------------
        # Plot the input and the various outputs that are
        # produced by running each of the various filters
        # on the same inputs.
        #--------------------------------------------------

        plot(x[10000:20000],data[10000:20000])
        plot(x[10000:20000],responsePylab[10000:20000])
        show()

        return
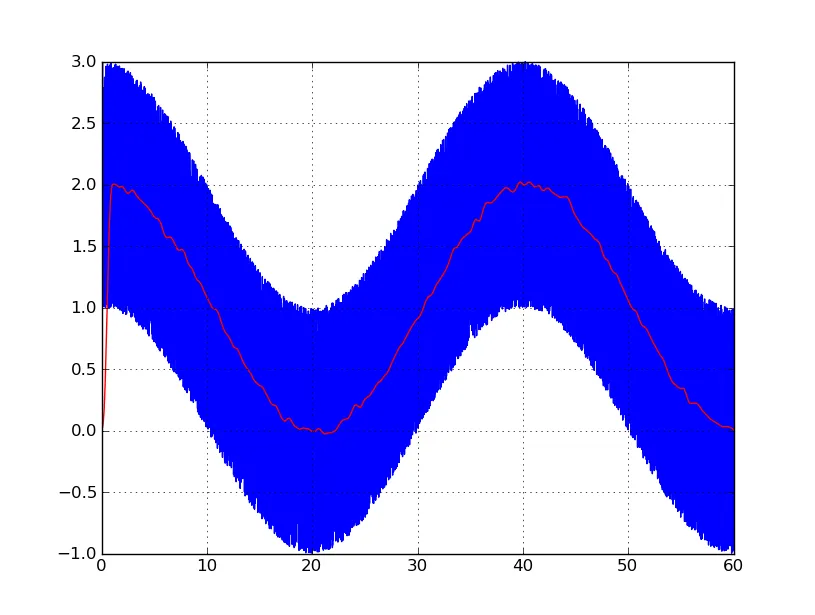 滤波输出延迟半秒钟(滤波器以第500个点为中心)。请注意,噪声添加的直流偏移量被低通滤波器保留。而且,0.025 Hz 在通频带范围内,所以从峰值到峰值的输出摆幅大约为2。