Python/Scipy中的多元样条插值?

31

有没有库模块或其他简单的方法来在Python中实现多元样条插值?

具体而言,我有一组标量数据,在一个定期间隔的三维网格上,需要在域内散布的少量点上进行插值。对于两个维度,我一直在使用 scipy.interpolate.RectBivariateSpline,我基本上正在寻找将其扩展到三维数据的方法。

我发现的N维插值例程还不够好:我更喜欢采用样条插值而不是LinearNDInterpolator 来获得平滑度,并且我的数据点过多(通常超过一百万),例如无法使用径向基函数。

如果有人知道可以做到这一点的Python库,或者可能在另一种语言中调用或移植的库,我会非常感激。


只是为了确认我理解得正确,你的数据已经在一个常规网格上,并且你想要在不规则点上进行插值吗?(如果是这样,你需要使用scipy.ndimage.map_coordinates,我稍后会发布一个示例......) - Joe Kington
2个回答

47
如果我理解你的问题正确,你的输入“观测”数据是定期网格化的吗?
如果是这样,scipy.ndimage.map_coordinates 正是你想要的。
一开始有点难理解,但本质上,你只需要提供一个坐标序列,以像素/体素/n维索引坐标的形式插值网格值。
以2D为例:
import numpy as np
from scipy import ndimage
import matplotlib.pyplot as plt

# Note that the output interpolated coords will be the same dtype as your input
# data.  If we have an array of ints, and we want floating point precision in
# the output interpolated points, we need to cast the array as floats
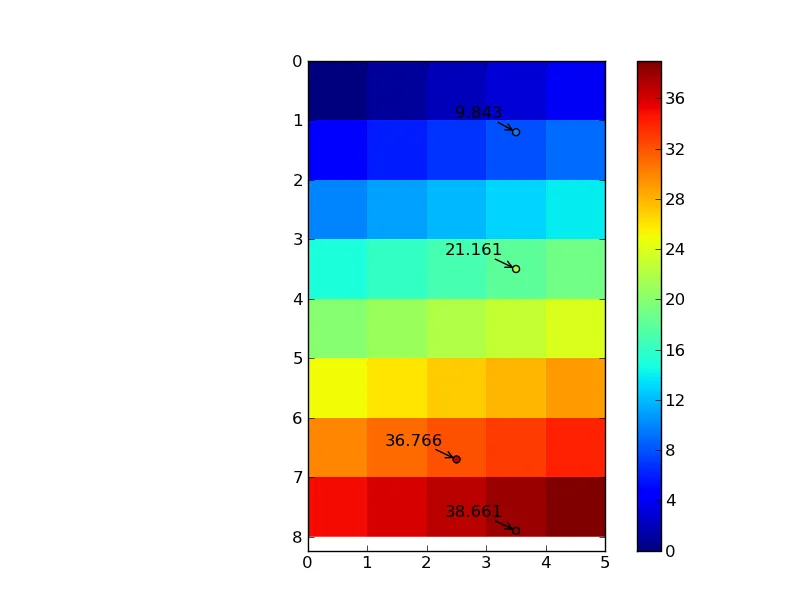
data = np.arange(40).reshape((8,5)).astype(np.float)

# I'm writing these as row, column pairs for clarity...
coords = np.array([[1.2, 3.5], [6.7, 2.5], [7.9, 3.5], [3.5, 3.5]])
# However, map_coordinates expects the transpose of this
coords = coords.T

# The "mode" kwarg here just controls how the boundaries are treated
# mode='nearest' is _not_ nearest neighbor interpolation, it just uses the
# value of the nearest cell if the point lies outside the grid.  The default is
# to treat the values outside the grid as zero, which can cause some edge
# effects if you're interpolating points near the edge
# The "order" kwarg controls the order of the splines used. The default is 
# cubic splines, order=3
zi = ndimage.map_coordinates(data, coords, order=3, mode='nearest')

row, column = coords
nrows, ncols = data.shape
im = plt.imshow(data, interpolation='nearest', extent=[0, ncols, nrows, 0])
plt.colorbar(im)
plt.scatter(column, row, c=zi, vmin=data.min(), vmax=data.max())
for r, c, z in zip(row, column, zi):
    plt.annotate('%0.3f' % z, (c,r), xytext=(-10,10), textcoords='offset points',
            arrowprops=dict(arrowstyle='->'), ha='right')
plt.show()

enter image description here

要在n维中完成这个操作,我们只需要传入相应大小的数组:

import numpy as np
from scipy import ndimage

data = np.arange(3*5*9).reshape((3,5,9)).astype(np.float)
coords = np.array([[1.2, 3.5, 7.8], [0.5, 0.5, 6.8]])
zi = ndimage.map_coordinates(data, coords.T)

就缩放和内存使用而言,如果您使用的是顺序> 1(即非线性插值),map_coordinates将创建一个过滤后的数组副本。 如果您只想在很少的点上进行插值,则这是一个相当大的开销。 但是,它不会随着您想要插值的点数增加而增加。 只要有足够的RAM来存储输入数据数组的单个临时副本,就可以了。
如果您无法在内存中存储数据副本,则可以a)指定prefilter = Falseorder = 1并使用线性插值,或者b)使用ndimage.spline_filter替换原始数据的过滤版本,然后使用prefilter = False调用map_coordinates。
即使您有足够的内存,如果需要多次调用map_coordinates(例如交互式使用等),保留过滤后的数据集也可以大大加快速度。

有没有可能为非结构化的3D数据添加样条线?(在这里提问 - uhoh

3

在维度大于2的情况下,平滑样条插值很难实现,因此没有太多可以做到这一点的免费库(事实上,我不知道有哪个库可以实现)。

您可以尝试使用反距离加权插值,参见:Python中的反距离加权(IDW)插值。 这应该能产生相当平滑的结果,并且比RBF更适用于较大的数据集。


8
在几乎所有情况下,IDW 都是一个非常糟糕的选择。它假定所有输入数据点都是局部最小值或最大值!我不确定人们是否将其用作一般插值技术......(尽管很多人确实这样做!)除非你特别希望在观测点周围出现 "靶心" 图案,否则这不是你想要的。无论如何,我认为 OP 有规则化格网数据需要得到点内插值,而不是插值不规则点。在这种情况下,有更好的选择。 - Joe Kington
6
顺带一提,我并不是想听起来这么粗鲁...我只是对IDW作为插值方法有一点怨念而已! :) - Joe Kington
1
@Joe Kington,(在您众多的好回答和评论中错过了这个问题):您会建议哪些方法来插值2d、5d、10d的散乱/非均匀数据呢? 在2d / 3d中可以进行三角剖分,但是在10d中呢? - denis
3
@Denis - 谢谢 :) 径向基函数可能会很慢,但它们平滑且在高维下适应性强。只要你不是仅使用N个最近点进行优化,就完全不需要担心三角剖分。唯一的参数是距离,无论维度如何。希望这可以帮助到你。 - Joe Kington
@Joe Kington,你好Joe!感谢你提供的所有Python指导!我正在面对与OP相同的问题,并想知道在以下选项中哪个是最佳选择:(1)scipy.interpolate.interpn,(2)scipy.interpolate.RegularGridInterpolator和(3)scipy.ndimage.interpolation.map_coordinates。这些方法中是否有任何等效的,可能在幕后完全相同的,或者具有任何特定的速度,内存和/或准确性优势? - NLi10Me
显示剩余5条评论

网页内容由stack overflow 提供, 点击上面的
可以查看英文原文,
原文链接