背景/上下文
我试图复现scipy的ndimage.affine_transform函数的输出值,但是似乎我使用的“立方”插值方案与scipy实现不同。
示例
让我们看一个非常简单的例子(不是您想要使用立方插值的数据,但易于理解)。为了检查值,我实现了均匀Catmull-Rom样条。这是我的小型实现示例:
import numpy as np
from scipy.ndimage import affine_transform


def catmull_rom_interp(p0, p1, p2, p3, x):
    return (
        (-0.5 * p0 + 1.5 * p1 - 1.5 * p2 + 0.5 * p3) * (x ** 3)
        + (p0 - 2.5 * p1 + 2 * p2 - 0.5 * p3) * (x ** 2)
        + (-0.5 * p0 + 0.5 * p2) * x
        + p1
    )


image = np.zeros((9,))
image[3] = 13.3

scipy_result_filtered = affine_transform(
    image, np.eye(1), offset=-1.7, order=3, prefilter=True
)
scipy_result = affine_transform(image, np.eye(1), offset=-1.7, order=3, prefilter=False)

image_padded = np.pad(image, 3, mode="constant", constant_values=0)
result_manual = np.zeros((9,))

for i in range(9):
    result_manual[i] = catmull_rom_interp(*image_padded[i : i + 4], 0.3)

print(scipy_result)
print(scipy_result_filtered)
print(result_manual)

# yields
# [0. 0. 0.          0.05985    4.63061667  7.84921667  0.76031667 0.          0.        ]
# [0. 0. 0.1675183  -1.06094923 4.43537861 11.10313479 -1.75261778 0.46923634 -0.12432758]
# [0. 0. 0.         -0.41895    3.85035    10.84615    -0.97755    0.          0.        ]


#
#    PLOTTING
#

import matplotlib.pyplot as plt

plt.gca().grid()

plots = []
for i in range(9):
    plots.append(lambda x: catmull_rom_interp(*image_padded[i : i + 4], x))

plt.plot(scipy_result, "--", label="scipy", alpha=0.5)
plt.plot(scipy_result, "o", color=plt.get_cmap("tab10")(0))

plt.plot(scipy_result_filtered, "--", label="scipy filtered", alpha=0.5)
plt.plot(scipy_result_filtered, "o", color=plt.get_cmap("tab10")(1))
plt.plot(result_manual, "o")
for i in range(9):
    plt.plot(
        np.linspace(i - 0.3, i + 1 - 0.3, 100),
        plots[i](np.linspace(0, 1, 100)),
        "--",
        alpha=0.5,
        color=plt.get_cmap("tab10")(2),
        label="Catmull-Rom spline" if i == 0 else None,
    )

plt.plot(
    np.arange(-0.3, 8.8),
    [0] * 2 + list(image[:-1]),
    "o",
    label="Data to interpolate",
    color="k",
)


plt.legend(framealpha=1)
plt.show()
下面是可视化结果(请注意,由于不知道scipy函数的真实插值函数,我只画出了线性连接以更好地突出不同的数据点):
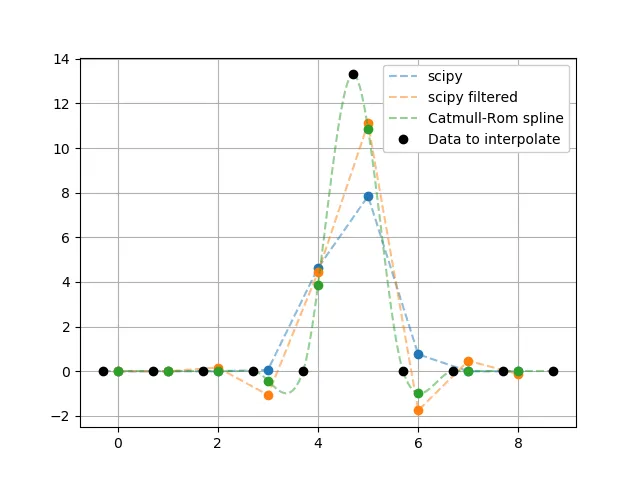
观察结果:
- Scipy方法不使用Catmull-Rom样条曲线
- Scipy方法(未过滤)不会产生过冲,这通常与锐利边缘的三次插值有关,但正如scipy文档中所提到的那样,会导致一些模糊,而且似乎与我在示例中使用的图像特定的移位有关
- 预处理的scipy方法更接近Catmull-Rom样条曲线,但并不相同(存在明显的差异)
问题
- Scipy使用哪种插值方案?
- 在他们的文档和/或代码中实际上在哪里可以找到它?
- 额外奖励:在Python中实现它的简单方法(用于检查目的)