到目前为止,您可能已经找到了Centripetal Catmull-Rom spline的维基百科页面,但是如果您还没有找到,它包括以下示例代码:
import numpy
import matplotlib.pyplot as plt
def CatmullRomSpline(P0, P1, P2, P3, nPoints=100):
"""
P0, P1, P2, and P3 should be (x,y) point pairs that define the
Catmull-Rom spline.
nPoints is the number of points to include in this curve segment.
"""
P0, P1, P2, P3 = map(numpy.array, [P0, P1, P2, P3])
alpha = 0.5
def tj(ti, Pi, Pj):
xi, yi = Pi
xj, yj = Pj
return ( ( (xj-xi)**2 + (yj-yi)**2 )**0.5 )**alpha + ti
t0 = 0
t1 = tj(t0, P0, P1)
t2 = tj(t1, P1, P2)
t3 = tj(t2, P2, P3)
t = numpy.linspace(t1,t2,nPoints)
t = t.reshape(len(t),1)
A1 = (t1-t)/(t1-t0)*P0 + (t-t0)/(t1-t0)*P1
A2 = (t2-t)/(t2-t1)*P1 + (t-t1)/(t2-t1)*P2
A3 = (t3-t)/(t3-t2)*P2 + (t-t2)/(t3-t2)*P3
B1 = (t2-t)/(t2-t0)*A1 + (t-t0)/(t2-t0)*A2
B2 = (t3-t)/(t3-t1)*A2 + (t-t1)/(t3-t1)*A3
C = (t2-t)/(t2-t1)*B1 + (t-t1)/(t2-t1)*B2
return C
def CatmullRomChain(P):
"""
Calculate Catmull Rom for a chain of points and return the combined curve.
"""
sz = len(P)
C = []
for i in range(sz-3):
c = CatmullRomSpline(P[i], P[i+1], P[i+2], P[i+3])
C.extend(c)
return C
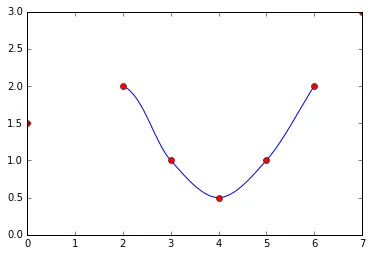
这个函数可以很好地计算出n >= 4个点的插值,如下所示:
points = [[0,1.5],[2,2],[3,1],[4,0.5],[5,1],[6,2],[7,3]]
c = CatmullRomChain(points)
px, py = zip(*points)
x, y = zip(*c)

plt.plot(x, y)
plt.plot(px, py, 'or')
导致这个
matplotlib图像的结果是:
更新:
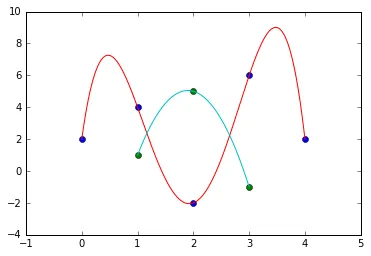
另外,有一个 scipy.interpolate 函数 BarycentricInterpolator 可以完成你所需的功能。它非常简单易用,并且适用于只有 3 个数据点的情况。
from scipy.interpolate import BarycentricInterpolator
points1 = [[0, 2], [1, 4], [2, -2], [3, 6], [4, 2]]
points2 = [[1, 1], [2, 5], [3, -1]]
x1, y1 =zip(*points1)
x2, y2 = zip(*points2)
bci1 = BarycentricInterpolator(x1, y1)
bci2 = BarycentricInterpolator(x2, y2)
x1_new = np.linspace(min(x1), max(x1), 1000)
x2_new = np.linspace(min(x2), max(x2), 1000)
plt.plot(x1, y1, 'o')
plt.plot(x2, y2, 'o')
plt.plot(x1_new, bci1(x1_new))
plt.plot(x2_new, bci2(x2_new))
plt.xlim(-1, 5)
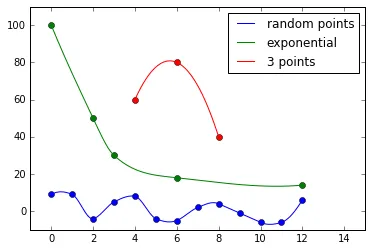
更新2
scipy中的另一个选项是通过Akima1DInterpolator进行akima插值。它与Barycentric一样容易实现,但具有避免数据集边缘处大振荡的优点。以下是一些展示到目前为止您所要求的所有标准的测试用例。
from scipy.interpolate import Akima1DInterpolator

x1, y1 = np.arange(13), np.random.randint(-10, 10, 13)
x2, y2 = [0,2,3,6,12], [100,50,30,18,14]
x3, y3 = [4, 6, 8], [60, 80, 40]

akima1 = Akima1DInterpolator(x1, y1)
akima2 = Akima1DInterpolator(x2, y2)
akima3 = Akima1DInterpolator(x3, y3)

x1_new = np.linspace(min(x1), max(x1), 1000)
x2_new = np.linspace(min(x2), max(x2), 1000)
x3_new = np.linspace(min(x3), max(x3), 1000)

plt.plot(x1, y1, 'bo')
plt.plot(x2, y2, 'go')
plt.plot(x3, y3, 'ro')
plt.plot(x1_new, akima1(x1_new), 'b', label='random points')
plt.plot(x2_new, akima2(x2_new), 'g', label='exponential')
plt.plot(x3_new, akima3(x3_new), 'r', label='3 points')
plt.xlim(-1, 15)
plt.ylim(-10, 110)
plt.legend(loc='best')
scipy.interpolate中没有找到任何看起来像是使用 Catmull-Rom 的东西。话虽如此,还有另一种样条方法,BarycentricInterpolator,看起来可能会满足你的需求。请给我一分钟更新我的答案。 - lanery