Matplotlib散点图点大小图例

3
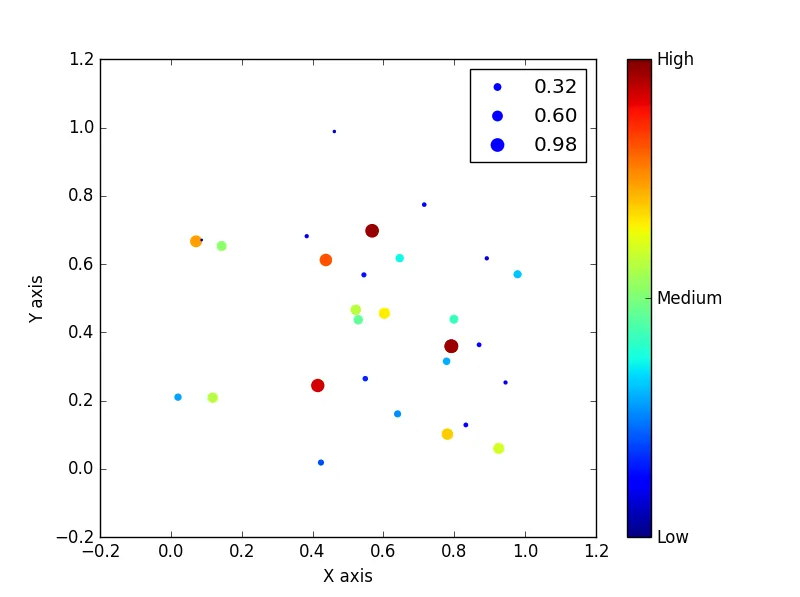
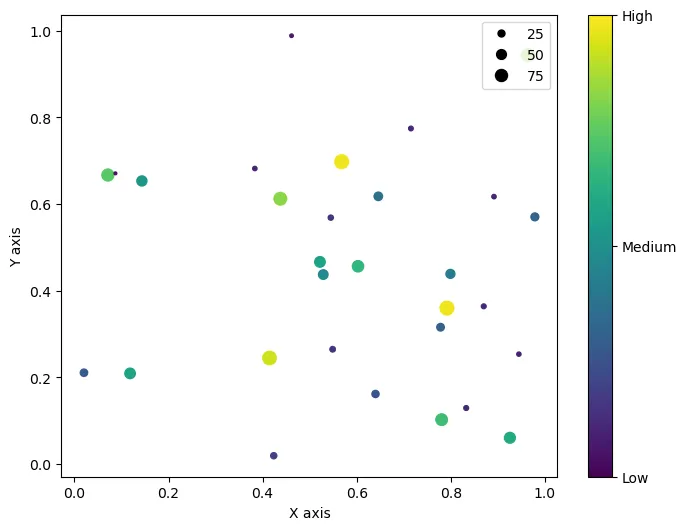
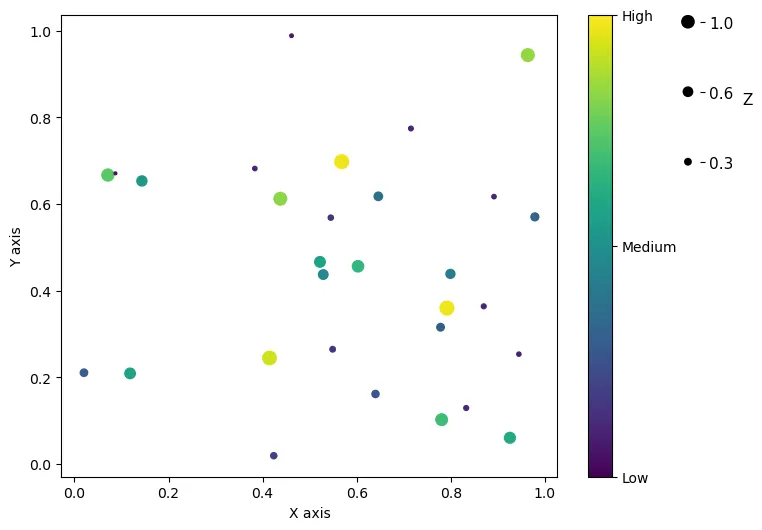
以下是使用matplotlib的散点图生成附加图像的一小段代码。Output image from code. 
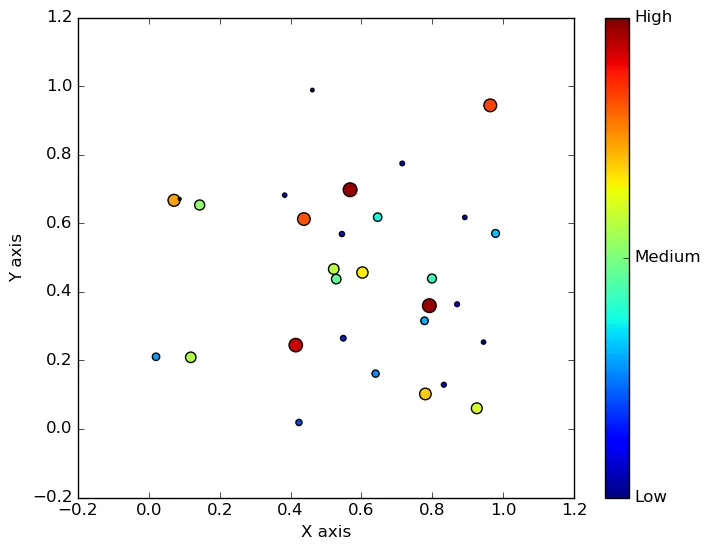
我正在尝试获取一个“图例”,显示几个点的大小和相应的“z值”。
除了自己构建之外,是否有类似于这样的东西?一个与色条类似的“大小”类比?
import matplotlib.pyplot as plt
import numpy as np

fig = plt.figure(figsize=(8,6))
inset = fig.add_subplot(111)

np.random.seed(0) # so the image is reproducible
x1 = np.random.rand(30)
y1 = np.random.rand(30)
z1 = np.random.rand(30)


axis = inset.scatter(x1,y1,s=z1*100,c=z1,vmin=0,vmax=1)

inset.set_xlabel("X axis")
inset.set_ylabel("Y axis")

cbar = fig.colorbar(axis,ticks=[0,0.5,1])
cbar.ax.set_yticklabels(["Low","Medium","High"])

plt.savefig('scatterplot-zscale.png',bbox_inches='tight')
3个回答

3

要获得图例,您需要在调用scatter时至少在一个数据点上传递关键字label。一种方法是从您的数据中选择3个代表性点,并再次将它们添加到图中并标记。

import matplotlib.pyplot as plt
import numpy as np

np.random.seed(0) # so the image is reproducible
x1 = np.random.rand(30)
y1 = np.random.rand(30)
z1 = np.random.rand(30)

fig = plt.figure(figsize=(8,6))
inset = fig.add_subplot(111)
# i prefer no outlines on the dots, so edgecolors='none'
axis = inset.scatter(x1,y1,s=z1*100,c=z1,vmin=0,vmax=1,edgecolors='none')

inset.set_xlabel("X axis")
inset.set_ylabel("Y axis")

cbar = fig.colorbar(axis,ticks=[0,0.5,1])
cbar.ax.set_yticklabels(["Low","Medium","High"])

# here we step over the sorted data into 4 or 5 strides and select the 
# last 3 steps as a representative sample, this only works if your 
# data is fairly uniformly distributed
legend_sizes = np.sort(z1)[::len(z1)//4][-3:]

# get the indices for each of the legend sizes
indices = [np.where(z1==v)[0][0] for v in legend_sizes]

# plot each point again, and its value as a label
for i in indices:
    inset.scatter(x1[i],y1[i],s=100*z1[i],c=z1[i], vmin=0,vmax=1,edgecolors='none',
                  label='{:.2f}'.format(z1[i]))
# add the legend
inset.legend(scatterpoints=1)

enter image description here


非常好用。谢谢! - John Pretz

0

在Stackoverflow上有一个更简单的解决方案。 创建与matplotlib散点图图例大小相关的内容

使用.legend_elements("sizes"):

import matplotlib.pyplot as plt
import numpy as np

fig = plt.figure(figsize=(8,6))
inset = fig.add_subplot(111)

np.random.seed(0) # so the image is reproducible
x1 = np.random.rand(30)
y1 = np.random.rand(30)
z1 = np.random.rand(30)


axis = inset.scatter(x1,y1,s=z1*100,c=z1,vmin=0,vmax=1)

inset.set_xlabel("X axis")
inset.set_ylabel("Y axis")

cbar = fig.colorbar(axis,ticks=[0,0.5,1])
cbar.ax.set_yticklabels(["Low","Medium","High"])

plt.legend(*axis.legend_elements("sizes", num=5), loc = 'upper right')

plt.savefig('scatterplot-zscale.png',bbox_inches='tight')

带有尺寸图例的图表


0

上述解决方案创建的大小图例在美学上与色条不一致。

为了以与色条相同的格式呈现大小信息,您可以在色条轴旁边创建一个新轴,并在该轴上绘制一些示例标记,如下所示。

import matplotlib.pyplot as plt
import numpy as np

fig = plt.figure(figsize=(8,6))
inset = fig.add_subplot(111)

np.random.seed(0) # so the image is reproducible
x1 = np.random.rand(30)
y1 = np.random.rand(30)
z1 = np.random.rand(30)


axis = inset.scatter(x1,y1,s=z1*100,c=z1,vmin=0,vmax=1)

inset.set_xlabel("X axis")
inset.set_ylabel("Y axis")

cbar = fig.colorbar(axis,ticks=[0,0.5,1])
cbar.ax.set_yticklabels(["Low","Medium","High"])

legend_values = np.sort(z1)[::len(z1)//4][-3:]

# get the indices for each of the legend sizes
indices = [np.where(z1==v)[0][0] for v in legend_values]

# Create new axis to record size legend

# Get bounds of colorbar axis
xmin, ymin, dx, dy = cbar.ax.get_position().bounds

# Create new axis that is shorter but hase same width and aligns with the top of the colourbar axis
xmin = xmin+0.11
ymin = ymin+dy - dy/3
dx = dx
dy = dy/3
sax = fig.add_axes([xmin, ymin, dx, dy])

# Plot legend size entries onto this axis
x = [0]*len(legend_values)
y = range(len(legend_values))
sizes = legend_values*100
sax.scatter(x, y, s = sizes, c = 'black', edgecolors = 'none', marker = 'o')

# Add y axis labels and remove x ticks
sax.yaxis.set_label_position("right")
sax.yaxis.tick_right()
sax.set_yticks(y)
sax.set_yticklabels(np.round_(legend_values, decimals=1), fontdict = {'size':11})
sax.set_ylabel('Z', rotation=0, labelpad = 10, fontdict = {'size':11})
sax.set_xticks([])

# remove spines
for pos in ['right', 'top', 'bottom', 'left']:
    sax.spines[pos].set_visible(False)

plt.savefig('scatterplot-zscale.png',bbox_inches='tight')

带有颜色条和“尺寸条”的图表


网页内容由stack overflow 提供, 点击上面的
可以查看英文原文,
原文链接