如何在Matplotlib散点图中添加图例
6
- Lunalight
9
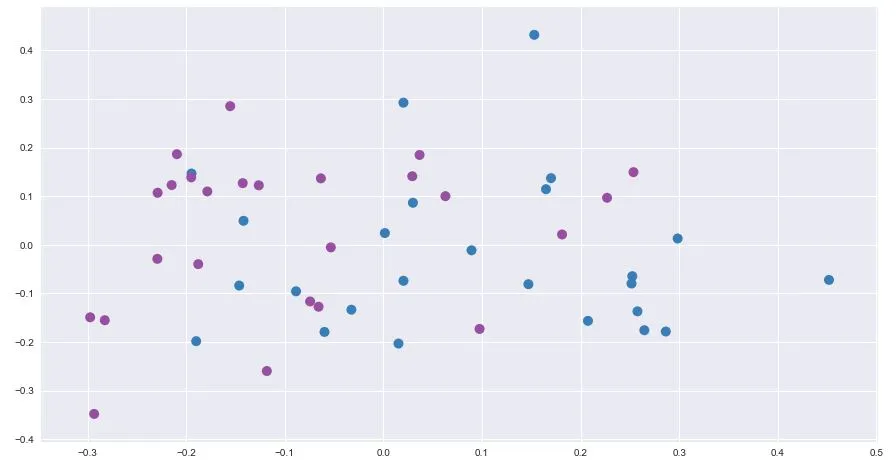
没有,我没有。我猜那就是问题所在。所有的信息都在x1和x2中,而这些已经通过第一个ax1.scatter()绘制出来了。 - Lunalight
当我尝试那样做时,我得到TypeError:'PathCollection'对象不可迭代。 - Lunalight
给我同样的问题,TypeError: 'PathCollection' 对象不可迭代。 - Lunalight
同样的 TypeError :( - Lunalight
传说起作用了!X_bar的形状是(50,2);X_bar本身是一个numpy.ndarray。 - Lunalight
显示剩余4条评论
1个回答
4
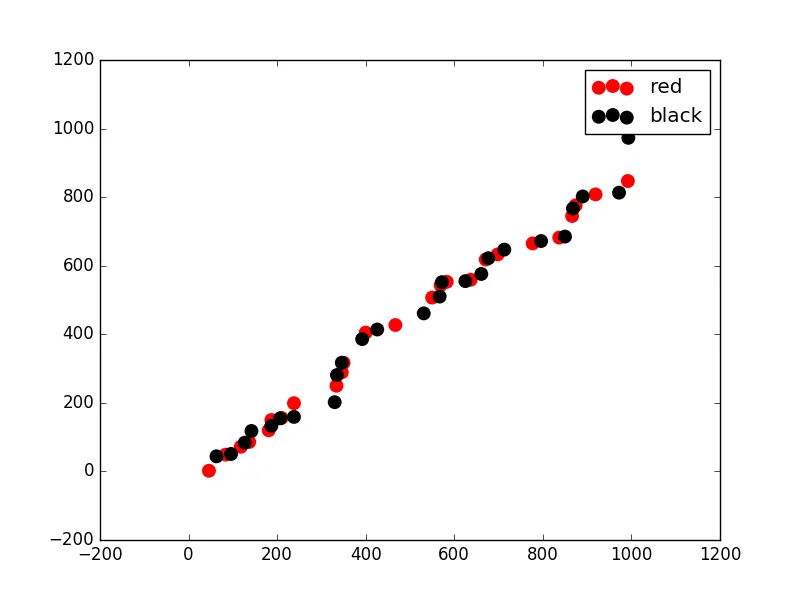
看起来你正在绘制每个点在两种颜色之间振荡。根据这个问题的答案(在numpy数组中每隔n个条目进行子采样),你可以使用numpy数组切片来绘制两个独立的数组,然后像往常一样添加图例。 以下是一些示例数据:
import numpy as np
import numpy.random as nprnd
import matplotlib.pyplot as plt

A = nprnd.randint(1000, size=100)
A.shape = (50,2)

x1, x2 = np.sort(A[:,0], axis=0), np.sort(A[:,1], axis=0)

x1
Out[50]:
array([ 46,  63,  84,  96, 118, 127, 137, 142, 181, 187, 187, 207, 210,
       238, 238, 330, 334, 335, 346, 346, 350, 392, 400, 426, 467, 531,
       550, 567, 569, 572, 583, 625, 637, 661, 671, 677, 698, 713, 777,
       796, 837, 850, 866, 868, 874, 890, 919, 972, 992, 993])
x2
Out[51]:
array([  2,  44,  49,  51,  72,  84,  86, 118, 120, 133, 150, 155, 156,
       159, 199, 202, 250, 281, 289, 317, 317, 386, 405, 414, 427, 461,
       507, 510, 543, 552, 553, 555, 559, 576, 618, 622, 633, 647, 665,
       672, 682, 685, 745, 767, 776, 802, 808, 813, 847, 973])


labels=['blue','red']

fig, ax1 = plt.subplots()
ax1.scatter(x1[0::2], x2[0::2], 100, edgecolors='none', c='red', label = 'red')
ax1.scatter(x1[1::2], x2[1::2], 100, edgecolors='none', c='black', label = 'black')

plt.legend()
plt.show()
针对你的代码,你可以这样做:
sns.set(style = 'darkgrid')
fig, ax1 = sns.plt.subplots()

x1, x2 = X_bar[:,0], X_bar[:,1]
ax1.scatter(x1[0::2], x2[0::2], 100, edgecolors='none', c = colors[0], label='one')
ax1.scatter(x1[1::2], x2[1::2], 100, edgecolors='none', c = colors[1], label='two')
fig.set_figheight(8)
fig.set_figwidth(15)
plt.legend()
- Chuck
网页内容由stack overflow 提供, 点击上面的可以查看英文原文,
原文链接
原文链接

