matplotlib如何为单个散点图添加多个图例项

3

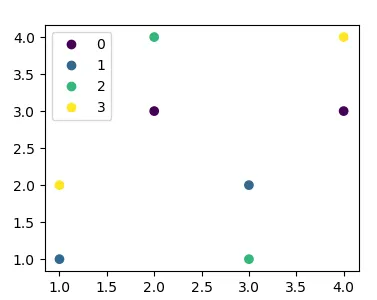
我正在为一个数据集制作散点图,它看起来像这样:

x = [1, 1, 2, 2, 3, 3, 4, 4]
y = [1, 2, 3, 4, 1, 2, 3, 4]
labels = [1, 3, 0, 2, 2, 1, 0, 3]

colors = np.array(plt.rcParams['axes.prop_cycle'].by_key()['color'])

plt.scatter(x, y, color=colors[labels])
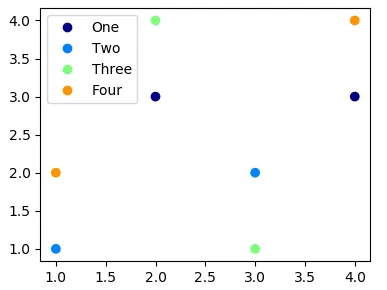
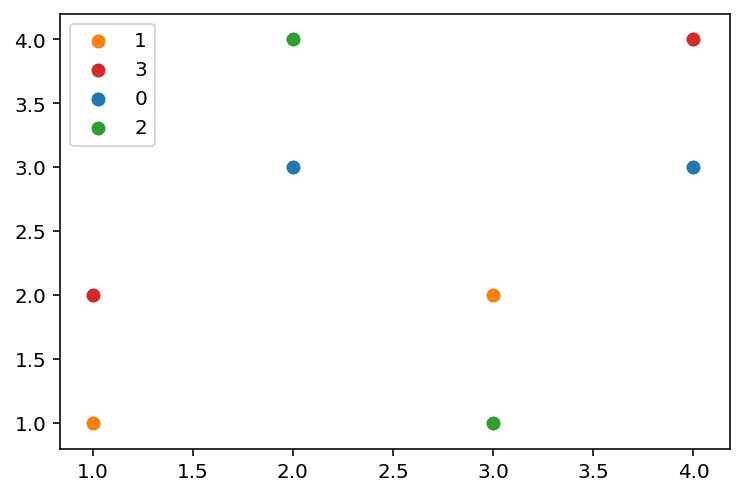
如果我调用plt.legend,只会显示一个条目,并使用第一个符号来表示整个数据集。如何创建一个图例,其中包含所有四个元素,显示为如果我已经绘制了四个单独的数据集?可能相关:带有多个图例条目的Matplotlib直方图基于:Matplotlib,如何循环?
3个回答

4
我认为最简单的解决方案是将所有工作委托给matplotlib。该方法在此处描述:https://matplotlib.org/gallery/lines_bars_and_markers/scatter_with_legend.html#automated-legend-creation。对于这种简化的方法,只需使用PathCollectionlegend_elements方法即可:
s = plt.scatter(x, y, c=labels)
plt.legend(*s.legend_elements())

enter image description here

更改颜色映射或将标签替换为其他内容(例如文本)非常简单:

text_labels = ['one', 'two', 'three', 'four']
s = plt.scatter(x, y, c=labels, cmap='jet', vmin=0, vmax=4)
plt.legend(s.legend_elements()[0], text_labels)

enter image description here

如果labels还不是一个在范围[0-n)内已排序的元素数组,可以使用np.unique轻松获取:
labels = ['b', 'd', 'a', 'c', 'c', 'b', 'a', 'd']
text_labels, labels = np.unique(labels, return_inverse=True)

3

您可以为标签集绘制空列表:

for l in set(labels):
    plt.scatter([],[], color=colors[l], label=l)
plt.legend()

1
这绝对是一个好主意。如果我将原始数据集保持未标记,它就不会出现在图例中。 - undefined
我觉得我找到了一个内置的方法,可以说比这个更高效。 - undefined

1

这只是实现所需结果的另一种方式。我使用this的解决方案来消除重复。

for i, j, l in zip(x, y, labels):
    plt.scatter(i, j, c=colors[l], label=l)

handles, labels = plt.gca().get_legend_handles_labels()
by_label = dict(zip(labels, handles))
plt.legend(by_label.values(), by_label.keys())

enter image description here


从技术上讲,是的,但我真的想尽量避免将每个点都放在单独的对象中。我觉得这样做不会很好地扩展。 - undefined
1
我觉得我找到了一个内置的方法。我从来不知道matplotlib会为你做这个。 - undefined

网页内容由stack overflow 提供, 点击上面的
可以查看英文原文,
原文链接