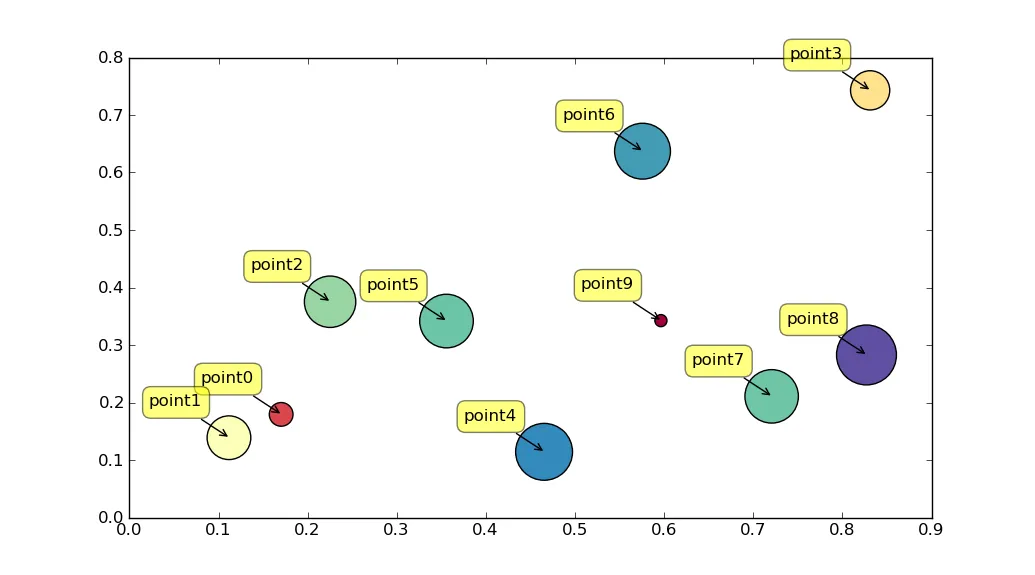
如何为Matplotlib散点图放置个别标签?

221

我正在尝试在matplotlib中制作散点图,但我找不到一种方法来向点添加标签。例如:

scatter1=plt.scatter(data1["x"], data1["y"], marker="o",
                     c="blue",
                     facecolors="white",
                     edgecolors="blue")

我希望"y"中的点有标签,如“点1”,“点2”等。但我无法弄清楚该怎么做。

2个回答

384

或许可以使用 plt.annotate

import numpy as np
import matplotlib.pyplot as plt

N = 10
data = np.random.random((N, 4))
labels = ['point{0}'.format(i) for i in range(N)]

plt.subplots_adjust(bottom = 0.1)
plt.scatter(
    data[:, 0], data[:, 1], marker='o', c=data[:, 2], s=data[:, 3] * 1500,
    cmap=plt.get_cmap('Spectral'))

for label, x, y in zip(labels, data[:, 0], data[:, 1]):
    plt.annotate(
        label,
        xy=(x, y), xytext=(-20, 20),
        textcoords='offset points', ha='right', va='bottom',
        bbox=dict(boxstyle='round,pad=0.5', fc='yellow', alpha=0.5),
        arrowprops=dict(arrowstyle = '->', connectionstyle='arc3,rad=0'))

plt.show()

在此输入图片描述


8
我本来也想说这个。链接到文档:http://matplotlib.sourceforge.net/api/pyplot_api.html#matplotlib.pyplot.annotate 链接到演示:http://matplotlib.sourceforge.net/examples/pylab_examples/annotation_demo2.html - Paul
4
可以使用数字(或标签)代替点吗? - Vladtn
16
你可以通过省略
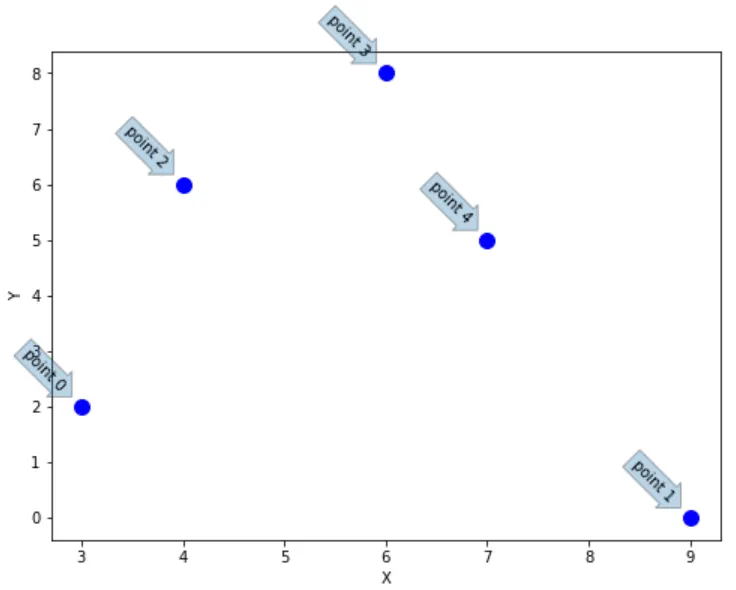
plt.scatter来移除圆圈。你可以使用plt.annotate(label, xy = (x, y), xytext = (0, 0), textcoords = 'offset points')在图像上放置任意文本。注意,xytext = (0, 0)表示没有偏移量,并且省略arrowprops会使plt.annotate不绘制箭头。 - unutbu
我不得不修改标签的方式,变成了这样: xy=(x, y),xytext = (x - 20, y + 20)否则它会将所有标签堆叠在一个点上。 - JBWhitmore
1
@OParker:将'point{0}'.format(i)更改为'point{0}'.format(i+1)。或者,您可以更改range['point{0}'.format(i) for i in range(N)]['point{0}'.format(i) for i in range(1,N+1)] - unutbu
显示剩余5条评论

0
另一个选择可能是使用plt.text。这里有一个可重现的例子:
import numpy as np
import matplotlib.pyplot as plt

np.random.seed(20)

N = 5
X=np.random.randint(10, size=(N))
Y=np.random.randint(10, size=(N))

data = np.random.random((N, 4))
annotations= ['point {0}'.format(i) for i in range(N)]

plt.figure(figsize=(8,6))
plt.scatter(X, Y, s=100, color = "blue")
plt.xlabel("X")
plt.ylabel("Y")
for i, label in enumerate(annotations):
    plt.text(X[i]-0.6, Y[i]+0.3,label, rotation = -45,
            bbox=dict(boxstyle="rarrow,pad=0.3", alpha = 0.3))

plt.show()

输出:

enter image description here


网页内容由stack overflow 提供, 点击上面的
可以查看英文原文,
原文链接