散点图x轴标签的matplotlib

23
当我在matplotlib中的散点图中添加c选项时,x轴标签会消失。这是一个例子:https://github.com/Kornel/scatterplot-matplotlib/blob/master/Scatter%20plot%20x%20axis%20labels.ipynb 这是与笔记本中相同的例子:
import pandas as pd
import matplotlib.pyplot as plt


test_df = pd.DataFrame({
        "X": [1, 2, 3, 4],
        "Y": [5, 4, 2, 1],
        "C": [1, 2, 3, 4]
    })

现在比较一下结果:
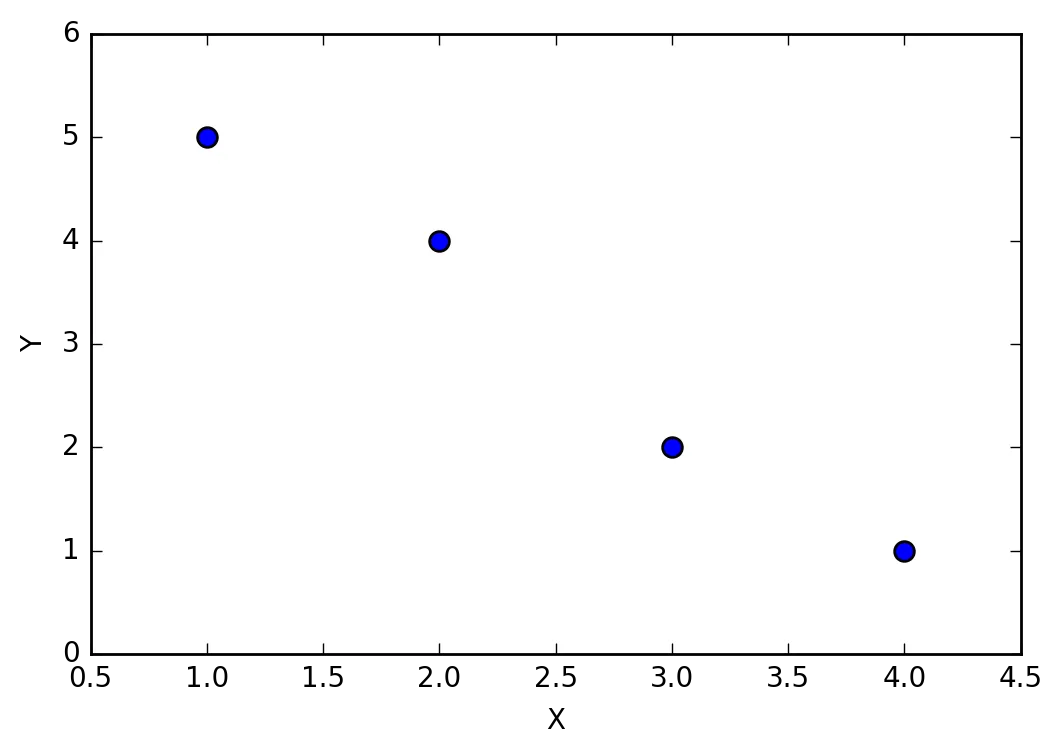
test_df.plot(kind="scatter", x="X", y="Y", s=50);

here the x axis labels are present

To:

test_df.plot(kind="scatter", x="X", y="Y", c="C");

enter image description here

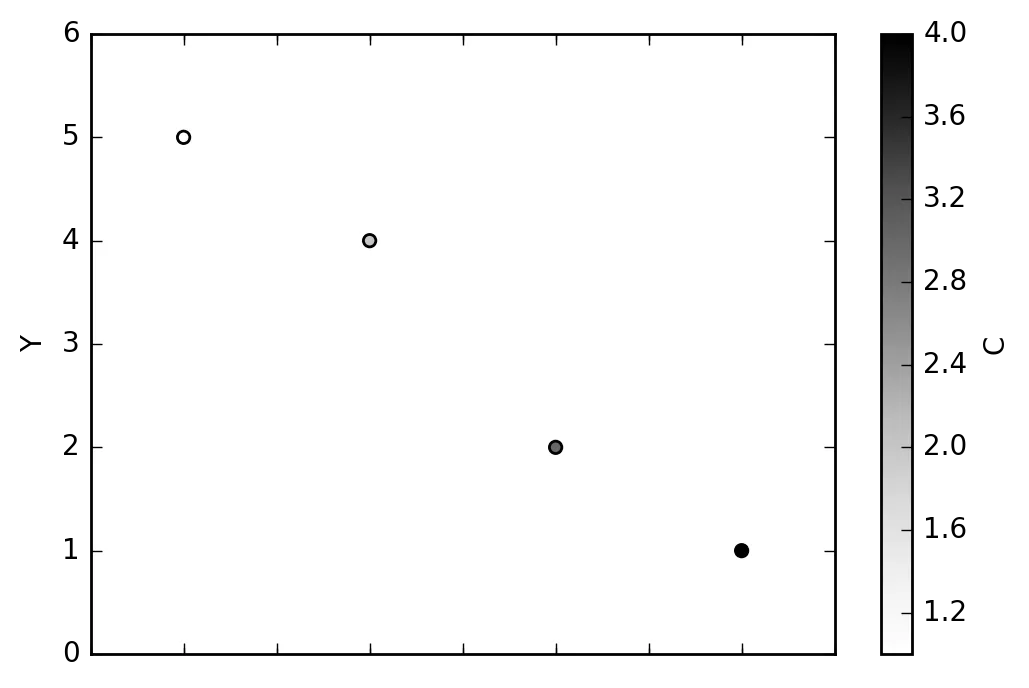
横轴标签在哪里?这是我错过的一个功能吗?

Pandas版本:0.18.1 Matplotlib版本:1.5.3 Python版本:3.5.2

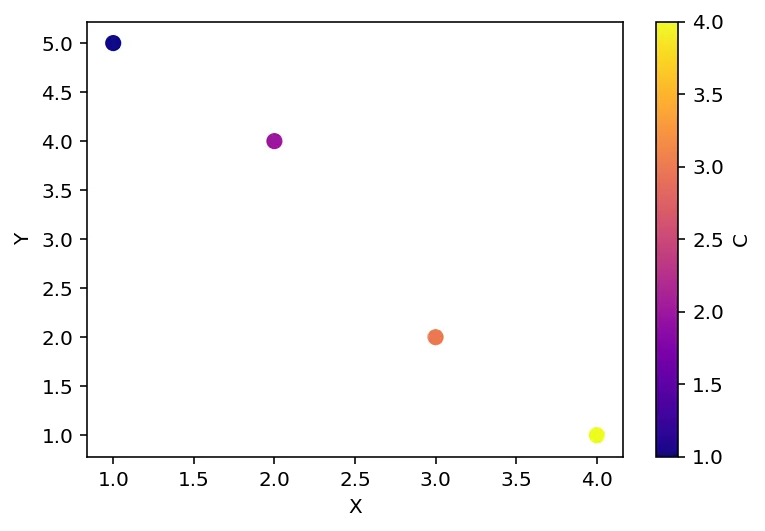
编辑:正如@Kewl指出的,解决方案是调用plt.subplots并指定轴:

fig, ax = plt.subplots()
test_df.plot(kind="scatter", x="X", y="Y", s=50, c="C", cmap="plasma", ax=ax);

提供

solved

P.S. 看起来像是一个 Jupyter 的问题,当在没有 Jupyter 笔记本的情况下调用时,标签是正常的。

只是想说我尝试从anaconda控制台启动的python shell中运行相同的代码,我能够看到“X”标签。pd.__version__:0.19.2 matplotlib.__version__:2.0.0 Python 3.6.0。也许只是这些软件包中一个或多个的版本问题?如果我有时间(或者如果我是你),我会尝试使用新的conda(或虚拟)环境进行测试,以查看是否可以解决问题... - umbe1987
1
另外,你是否尝试过仅将代码作为笔记本(使用Jupyter)运行?如果是这样,我建议你不要使用笔记本来测试它,以查看是否只是因为笔记本框架中没有足够的空间而导致“X”轴未显示出来(这只是一个猜测)。 - umbe1987
1
@umbe1987 你说得对!它在jupyter之外可以工作。我尝试了调用tight_layout,但没有改变任何东西 :/ 看起来像是jupyter的一个bug。 - CatInABox
对我来说,使用conda-forge频道安装pandas有效。 conda install -c conda-forge pandas - c0degeas
3个回答

25

对我来说,这看起来像是Pandas绘图中的一个奇怪的错误!这里有一种解决方法:

fig, ax = plt.subplots()
df.plot(kind='scatter',x='X', y='Y', c='C', ax=ax)
ax.set_xlabel("X")
plt.show()

这将为您提供您所期望的图形:

在此输入图片描述


非常感谢!你知道什么很有趣吗?set_xlabel是多余的。调用plt.subplots就可以解决问题。请查看更新后的笔记本。 - CatInABox

1
你可以像这样做。
plt.scatter(x="X", y="Y", c=df.color)
plt.xlabel("X axis label")
plt.ylabel("Y axis label")

0
如果您正在使用Anaconda,使用conda-forge渠道安装pandas可以解决此问题。
conda install -c conda-forge pandas

Example Image


网页内容由stack overflow 提供, 点击上面的
可以查看英文原文,
原文链接