使用matplotlib为散点图添加X轴下方的标题

30

我对Python和Matplotlib库都比较陌生。我已经使用Matplotlib创建了一个散点图,现在希望在X轴下方添加标题。以下是我的代码:

from matplotlib import pyplot as plt
import numpy as np
from pylab import *

file = open('distribution.txt', 'r')

txt="I need the caption to be present a little below X-axis"

x=[]
y=[]
for line in file:
    new=line.rstrip()
    mystring=new.split("\t")
    x.append(mystring[0])
    y.append(mystring[1])


fig = plt.figure()
ax1 = fig.add_axes((0.1,0.4,0.8,0.5))
ax1.set_title("This is my title")
ax1.set_xlabel('X-axis')
ax1.set_ylabel('Y-axis')
ax1.scatter(x,y, c='r')
fig.text(.05,.05,txt)
plt.xlim(0, 1.05)
plt.ylim(0, 2.5)
plt.show()

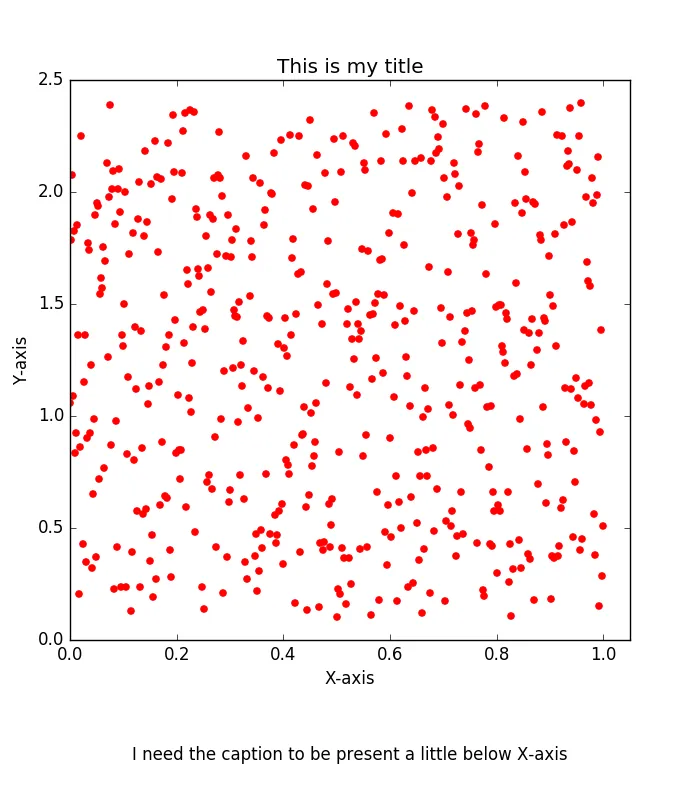
如您在图片中所见,我的标题远低于散点图,是否有办法将其准确地放在X轴下方?另外,我的散点图看起来是矩形的,有没有办法使其变成正方形?
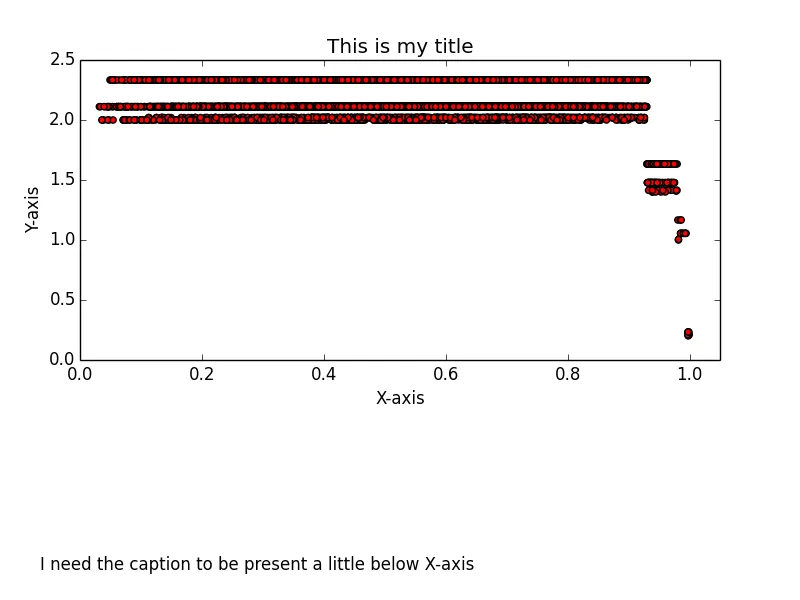
enter image description here

7个回答

52

你可以简单地使用figtext。你还可以根据需要更改x轴和y轴的值。

txt="I need the caption to be present a little below X-axis"
plt.figtext(0.5, 0.01, txt, wrap=True, horizontalalignment='center', fontsize=12)

1
它可以工作,但比fig.text少了面向对象的特性。+1 - mins

33

类似这样:

from matplotlib import pyplot as plt
import numpy as np

txt="I need the caption to be present a little below X-axis"

# make some synthetic data
x = np.linspace(0, 1, 512)
y = np.random.rand(512)*2.3 + .1

fig = plt.figure()
ax1 = fig.add_axes((0.1, 0.2, 0.8, 0.7))

ax1.set_title("This is my title")
ax1.set_xlabel('X-axis')
ax1.set_ylabel('Y-axis')

# make the edge colors match the facecolors
ax1.scatter(x,y, c='r', edgecolors='face')
# center text
fig.text(.5, .05, txt, ha='center')

# use OO interface    
ax1.set_xlim([0, 1.05])
ax1.set_ylim([0, 2.5])

# resize the figure to match the aspect ratio of the Axes    
fig.set_size_inches(7, 8, forward=True)

plt.show()

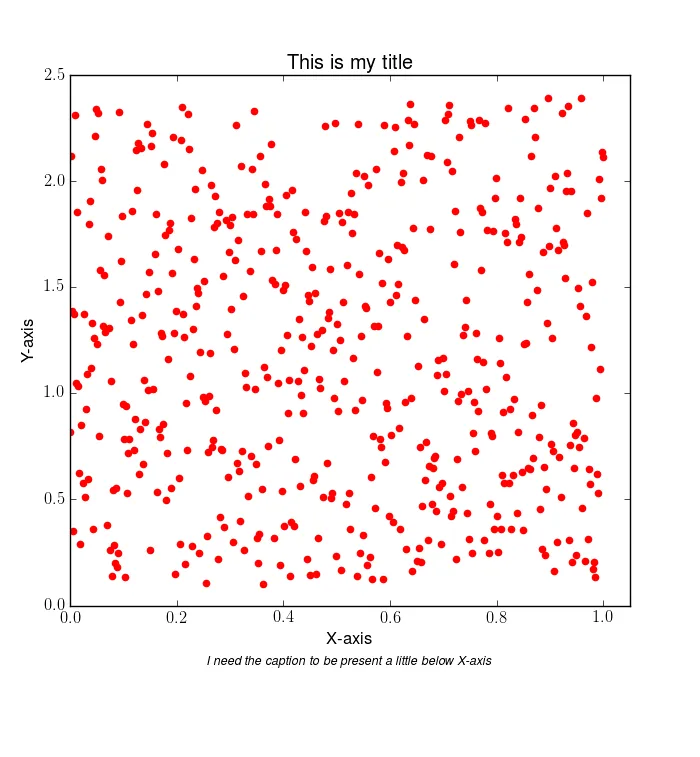
示例结果

可能有效。让这个过程更容易是 mpl 上游的一个关注点,但我们仍在寻找人来完成它。


2
五年后,似乎没有更好的解决方案。+1。请注意,y轴值可以为负数,以增加x标签和图例之间的间距。 - mins
6
我们刚刚合并了(就在两天前)一个PR,将类似于这个功能的内容添加到了Matplotlib的主线中。该功能将会在 mpl3.4(2022年1月) 中提供。https://github.com/matplotlib/matplotlib/pull/17524 - tacaswell

18
首先,我觉得在对matplotlib的联合开发者@tacaswell进行回答时有些奇怪。显然,他比我更了解matplotlib。但同时,他的答案对我来说不够灵活。我需要一个始终基于位置的标题,并且不能只使用文本注释。
我考虑简单地更改以添加换行符和标题文本,但这样无法清晰区分标题,并且无法在文本字符串中间更改文本大小或使其变为斜体。
我通过使用matplotlib的TeX功能来解决这个问题。这是我的解决方案:
from matplotlib import pyplot as plt
from matplotlib import rc
import numpy as np
from pylab import *

rc('text', usetex=True)

file = open('distribution.txt', 'r')

txt="I need the caption to be present a little below X-axis"

x=[]
y=[]
for line in file:
    new=line.rstrip()
    mystring=new.split("\t")
    x.append(mystring[0])
    y.append(mystring[1])


fig = plt.figure()
ax1 = fig.add_axes((0.1,0.4,0.8,0.5))
ax1.set_title("This is my title")
ax1.set_xlabel(r'\begin{center}X-axis\\*\textit{\small{' + txt + r'}}\end{center}')
ax1.set_ylabel('Y-axis')
ax1.scatter(x,y, c='r')
plt.xlim(0, 1.05)
plt.ylim(0, 2.5)
plt.show()

我用 tacaswell 的随机散点图做了同样的事情,这是我的结果: Scatter plot with caption 警告:如果你调整此代码以接受字符串变量作为输入,则这些字符串可能无法正确转义以供 TeX 使用。 转义 LaTeX 代码已在 Stack Overflow 上进行了讨论,网址为 https://dev59.com/6mQo5IYBdhLWcg3wKsxr#25875504 。 我直接使用了那个方法,然后就可以使用任意的 xlabels 和 captions。

1
这很好,但是我需要在Ubuntu上安装一些额外的软件包才能让它工作(我以前从未使用过LaTex):sudo apt install texlive texlive-latex-extra cm-super dvipng - mr.adam

8
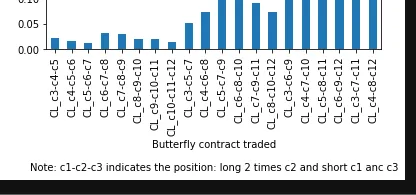
如@Nicky V所述。
plt.xlabel('''Butterfly contract traded

Note: c1-c2-c3 indicates the position: long 2 times c2 and short c1 anc c3''')

结果:

输入图像描述


4

当我无法以设计的方式完成任务时,我使用的另一种简单方法就是将一些新行添加到xlabel plt.xlabel("xaxis label\n\n\n\ncaption")。这只是将标题放在x轴下面几个新行,这使它看起来像一个标题,尽管它实际上是x轴标签的一部分。


1
是的,在使用figtext之后,我也知道在xlabel中使用\n是可以的。感谢您在这里发布它。 - Abu Shoeb

1

我发现了另一个技巧,使用plt.text(),您可以将y位置设置在绘图画布下方,并且它可以作为标题工作。您可以使用 \n 调整字体大小、颜色甚至换行符的位置。我正在使用这种方法。


0
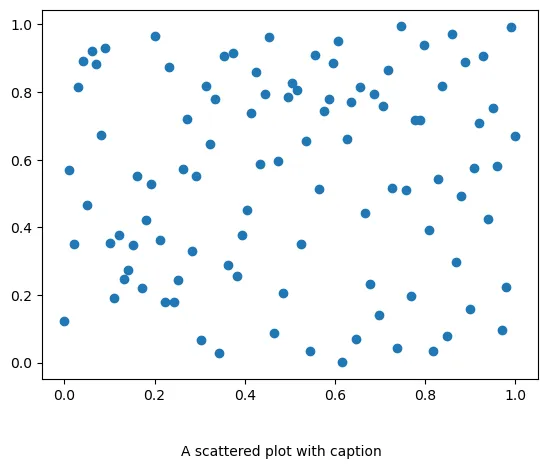
你可以简单地使用负的y位置来扩展图形超出当前大小。
fig.text(0.5, -0.05, 'some caption', ha='center')

坐标是指图形的位置,其中0,0表示左下角,而1,1对应右上角。

一个例子 -

import numpy as np
import matplotlib.pyplot as plt

x = np.linspace(0, 1, 100)
y = np.random.rand(100)
plt.scatter(x, y)
fig = plt.gcf()
fig.text(0.5, -0.05, 'A scattered plot with caption', ha='center')

A scattered plot with caption


网页内容由stack overflow 提供, 点击上面的
可以查看英文原文,
原文链接