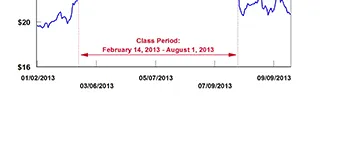
我需要创建以下图表。并且需要在x轴上显示日期,就像图片中那样。
但我只能生成如下图表。
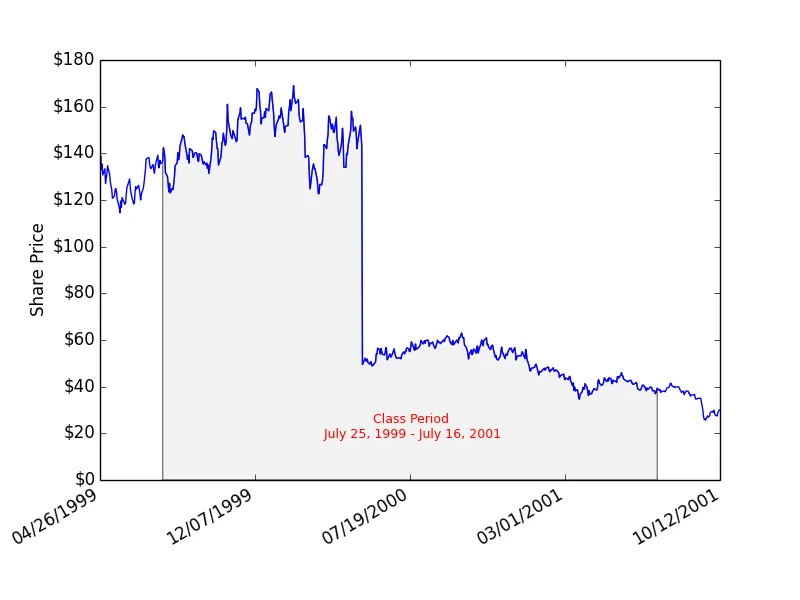
请查看我用于生成此图表的代码。
fig, ax = plt.subplots()
ax.plot(numpyTradeData.date, numpyTradeData.adj_close)

#Add Text in Grap
ax.text(0.5,0.1, 'Class Period\n %s - %s'%(clsStartPeriod.strftime('%B %d,
%Y'),clsEndPeriod.strftime('%B %d, %Y')),
horizontalalignment='center',
fontsize=9, color='red',
transform=ax.transAxes)

#Fill An Area in Graph
ax.fill_between(numpyTradeData.date[classStartPeriodIndex:classEndPeriodIndex], 0, numpyTradeData.adj_close[classStartPeriodIndex:classEndPeriodIndex], facecolor='0.9', alpha='0.5')

ax.xaxis.set_major_locator(LinearLocator(numticks=5))
ax.xaxis.set_major_formatter(dateStrFormatter)
ax.set_xlim(minDate,maxDate)
ax.set_ylabel('Share Price')

formatter = FuncFormatter(self.addDollarSymbol)
ax.yaxis.set_major_formatter(formatter)
fig.autofmt_xdate()
我知道可以添加旋转或垂直显示标签。但是无法弄清如何像第一张图片那样显示标签。