Matplotlib:如何在堆叠散点图中对齐y轴标签

32
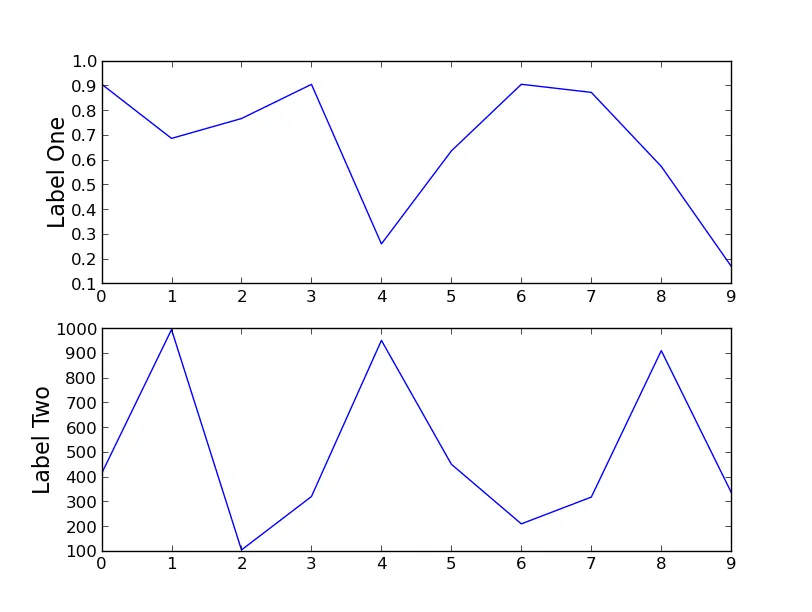
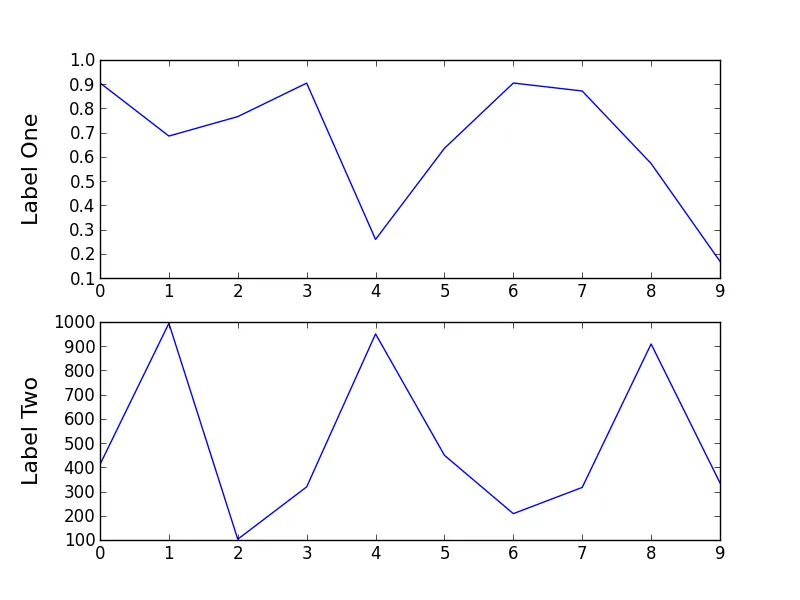
在下面的图中,我有两个散点图,它们具有不同的数值范围,因此它们的Y轴标签未对齐。是否有办法强制在y轴标签上水平对齐?

在下面的图表中,我有两个散点图,它们的数值比例不同,因此它们的Y轴标签没有对齐。是否有方法可以强制使Y轴标签水平对齐?

import matplotlib.pylab as plt
import random
import matplotlib.gridspec as gridspec

random.seed(20)
data1 = [random.random() for i in range(10)]
data2 = [random.random()*1000 for i in range(10)]

gs = gridspec.GridSpec(2,1)
fig = plt.figure()

ax = fig.add_subplot(gs[0])
ax.plot(data1)
ax.set_ylabel(r'Label One', size =16)

ax = fig.add_subplot(gs[1])
ax.plot(data2)
ax.set_ylabel(r'Label Two', size =16)

plt.show()

堆叠散点图


你想要的在这里描述:http://matplotlib.org/faq/howto_faq.html#align-my-ylabels-across-multiple-subplots - Saullo G. P. Castro
5个回答

34

你可以使用set_label_coords方法。

import matplotlib.pylab as plt
import random
import matplotlib.gridspec as gridspec

random.seed(20)
data1 = [random.random() for i in range(10)]
data2 = [random.random()*1000 for i in range(10)]

gs = gridspec.GridSpec(2,1)
fig = plt.figure()

ax = fig.add_subplot(gs[0])
ax.plot(data1)
ax.set_ylabel(r'Label One', size =16)
ax.get_yaxis().set_label_coords(-0.1,0.5)

ax = fig.add_subplot(gs[1])
ax.plot(data2)
ax.set_ylabel(r'Label Two', size =16)
ax.get_yaxis().set_label_coords(-0.1,0.5)

输入图像描述


谢谢!我试图做类似于“ax.get_yaxis().get_label().set_ha('left')”这样的事情,但它没有起作用。我想我没有完全理解标签对齐方式的工作原理。 - dimka
8
有没有一种自动确定 X 轴和 Y 轴刻度标签最小可接受距离的方法?也就是找到独立自动位置,然后将它们全部设置为最大值。 - andybuckley
5
@andybuckley,我刚刚试着自动对齐标签。你可以使用 ax.yaxis.label.get_position() 获取位置的最小/最大值,但是坐标空间与 ax.yaxis.set_label_coords() 使用的不同--你必须使用 ax.yaxis.label.set_position() 和一个技巧:ax.yaxis._autolabelpos=False ,否则当你调用 draw() 时它会重置位置。 - Samuel Powell
5
@SamPowell 很好,谢谢。不幸的是,这是一个很好的例子,说明在mpl中获得真正的“出版质量”图表是非常麻烦的,而且需要添加很多非常琐碎的代码来绕过理想的几行绘图代码 :-/ - andybuckley
@dimka请考虑取消接受这个答案,并接受Steven_Noyce的答案(下方)。 - GregarityNow

24

自这个问题发布以来,matplotlib已经添加了一个易于使用的函数来对齐标签。强制对齐标签的正确方法是在显示图形之前使用fig.align_labels()函数。

如果您需要更精细的控制,您也可以使用Figure.align_xlabels()Figure.align_ylabels()函数。

这里是该问题发布时的可工作版本代码。只需添加一行代码(倒数第二行)即可实施解决方案。

import matplotlib.pylab as plt
import random
import matplotlib.gridspec as gridspec

random.seed(20)
data1 = [random.random() for i in range(10)]
data2 = [random.random()*1000 for i in range(10)]

gs = gridspec.GridSpec(2,1)
fig = plt.figure()

ax = fig.add_subplot(gs[0])
ax.plot(data1)
ax.set_ylabel(r'Label One', size =16)

ax = fig.add_subplot(gs[1])
ax.plot(data2)
ax.set_ylabel(r'Label Two', size =16)

fig.align_labels()
plt.show()
请参考Matplotlib文档中有关对齐标签的内容以获取更多信息。

4

如评论中所述,您要解决的问题可以使用set_label_coords()来解决,具体请参见这里。对于您的情况,代码将类似于:

labelx = -0.5

ax = fig.add_subplot(gs[0])
ax.plot(data1)
ax.set_ylabel(r'Label One', size=16)
ax.yaxis.set_label_coords(labelx, 0.5)

ax = fig.add_subplot(gs[1])
ax.plot(data2)
ax.set_ylabel(r'Label Two', size=16)
ax.yaxis.set_label_coords(labelx, 0.5)

2

这是我编写的一个函数,用于自动对齐标签,但它似乎只在交互式环境下运行,而不能在脚本中运行。

def align_labels(axes_list,axis='y',align=None):
    if align is None:
        align = 'l' if axis == 'y' else 'b'
    yx,xy = [],[]
    for ax in axes_list:
        yx.append(ax.yaxis.label.get_position()[0])
        xy.append(ax.xaxis.label.get_position()[1])

    if axis == 'x':
        if align in ('t','top'):
            lim = max(xy)
        elif align in ('b','bottom'):
            lim = min(xy)
    else:
        if align in ('l','left'):
            lim = min(yx)
        elif align in ('r','right'):
            lim = max(yx)

    if align in ('t','b','top','bottom'):
        for ax in axes_list:
            t = ax.xaxis.label.get_transform()
            x,y = ax.xaxis.label.get_position()
            ax.xaxis.set_label_coords(x,lim,t)
    else:
        for ax in axes_list:
            t = ax.yaxis.label.get_transform()
            x,y = ax.yaxis.label.get_position()
            ax.yaxis.set_label_coords(lim,y,t)

还有一个例子:

fig,ax = subplots(2,2)
ax00,ax01 = ax[0]
ax10,ax11 = ax[1]
ax00.set_ylim(1000,5000)
ax00.set_ylabel('top')
ax10.set_ylabel('bottom')
ax10.set_xlabel('left')
ax11.set_xlabel('right')
ax11.xaxis.axis_date()
fig.autofmt_xdate()
#we have to call draw() so that matplotlib will figure out the automatic positions
fig.canvas.draw()
align_labels(ax[:,0],'y')
align_labels(ax[1],'x')

example figure


0

我会在最后提供一个解决方案,但首先我会告诉你哪些方法不会成功。

最近我重新审视了这个问题,并花费了相当长的时间尝试各种解决方案,即尝试几乎所有可能的坐标系之间的转换组合以及它们与tight_layout()的关系。我只尝试了backend_pdf,所以我无法对交互式媒体进行评估。但简而言之,我的结论是,无论您如何尝试找到位置并尝试转换它们,在此级别上都无法对齐轴标签。我猜想某种方式应该是可能的,例如在内部matplotlib能够对齐子图本身的轴。

只有通过两次绘制到pdf文件并在中间执行以下操作,我才能获得更好的位置,但仍然无法对齐:

# sorry for the `self`, this is from a class
def align_x_labels(self):
    self.lowest_ax = min(self.axes.values(),
                         key = lambda ax: ax.xaxis.label.get_position()[1])
    self.lowest_xlab_dcoo = self.lowest_ax.transData.transform(
        self.lowest_ax.xaxis.label.get_position())
    list(
        map(
                lambda ax: \
                    ax.xaxis.set_label_coords(
                        self.fig.transFigure.inverted().transform(
                            ax.transAxes.transform((0.5, 0.5)))[0],
                        self.fig.transFigure.inverted().transform(
                            self.lowest_xlab_dcoo)[1],
                        transform = self.fig.transFigure
                    ),
                self.axes.values()
            )
    )

很遗憾,这样一个基本的功能无法实现,而且在绘图的不同步骤中,不同的坐标空间是如何转换和重新缩放的也很难理解。我非常希望能看到一个清晰的解释,因为matplotlib网页只概述了架构,提供了简单的案例,但未能解释像这样的情况。此外,我惊讶地发现,接受或返回坐标的方法在其文档字符串中并没有说明这些坐标的类型。最后,我发现这个教程非常有用。

解决方案

最后,我没有再去处理转换,而是在GridSpec中创建了一个额外的零高度行和不可见轴(对于y轴标签,也可以使用零宽度列)。然后我为这些子图添加了标签,并将verticalalignment设置为top

# get one of the zero height phantom subplots to `self.ax`:
self.get_subplot(i, 1)
# set empty ticklabels:
self.ax.xaxis.set_ticklabels([])
self.ax.yaxis.set_ticklabels([])
# set the axis label:
self.ax.set_xlabel(labtext, fontproperties = self.fp_axis_lab)
# and this is matter of aesthetics
# sometimes bottom or center might look better:
self.ax.xaxis.label.set_verticalalignment('top')

网页内容由stack overflow 提供, 点击上面的
可以查看英文原文,
原文链接