Matplotlib中如何水平对齐两个y轴的标签

3
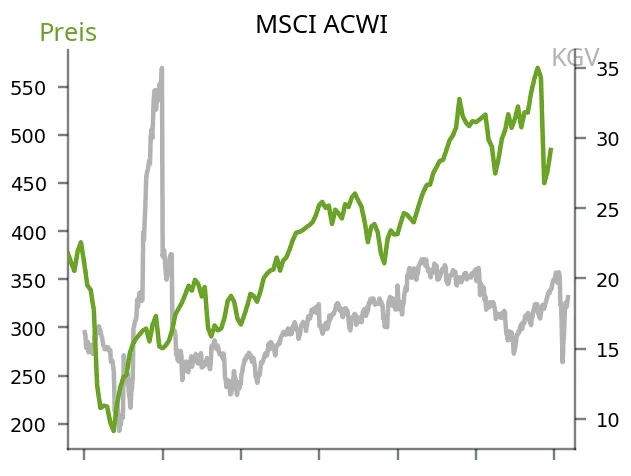
我正在尝试创建一个双轴图,其中y轴标签位于同一高度的轴顶部。
fig, ax = plt.subplots(1, 1)
ax.plot(data_left.index, data_left, label='Preis')
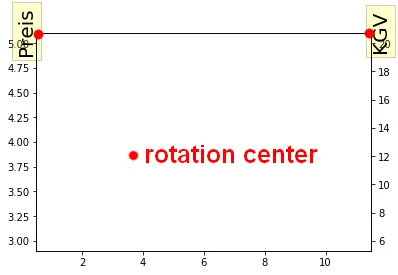
ax.set_ylabel('Preis', fontsize=label_size, rotation=0)
ax.yaxis.set_label_coords(0, 1.01)
ax2 = ax.twinx()
ax2.plot(data_right.index, data_right, label='KGV')
ax2.set_ylabel('KGV', fontsize=label_size, rotation=0)
ax2.yaxis.set_label_coords(1, 1.01)

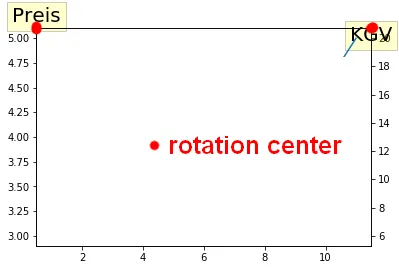
因此,我手动将y轴标签坐标高度设置为1.01对于两个轴,但它们是在完全不同的位置创建的。

enter image description here

当然,我可以尝试调整数值来找到匹配的位置,但我希望将这段代码用于不同的数据,并使标签自动放置在正确的位置。

  • 为什么这些标签位于完全不同的y坐标上?
  • 如何对齐它们的y位置,以便对于任何数据集和标签都能够对齐?
1个回答

2
这个按照你的意图工作了(rotation_mode=anchor + verticalalignment=baseline)。
fig, ax = plt.subplots(1, 1)
ax.plot(data_left.index, data_left, label='Preis')
ax.set_ylabel('Preis', fontsize=20, rotation=0, rotation_mode="anchor", verticalalignment='baseline')
ax.yaxis.set_label_coords(0, 1.01)
ax2 = ax.twinx()
ax2.plot(data_right.index, data_right, label='KGV')
ax2.set_ylabel('KGV', fontsize=20, rotation=0, rotation_mode="anchor", verticalalignment='baseline')
ax2.yaxis.set_label_coords(1, 1.01)

问题在于枢轴不在文本中心,而在y轴上。

before rotation

after rotation


谢谢,这正是我在寻找的,而且也非常合理! - Quastiat

网页内容由stack overflow 提供, 点击上面的
可以查看英文原文,
原文链接