问题 - 3D数组
问题: 2012年11月, 2013年10月
import numpy as np
a = np.random.random((2, 100, 4))
b = np.random.random((2, 100, 4))
c = np.random.random((2, 100, 4))
解决方案-字典唯一性
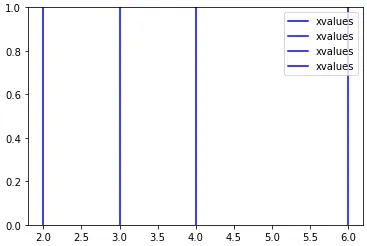
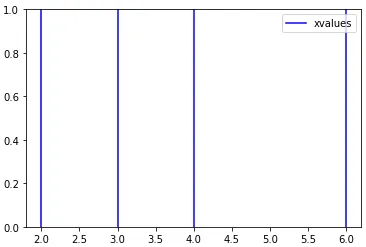
对于我的情况_nolegend_(bli和DSM)不起作用,label if i==0也不行。 ecatmur的答案使用get_legend_handles_labels并使用collections.OrderedDict将图例缩小。 Fons证明了这可以在没有导入的情况下实现。
与这些答案相符的是,我建议使用dict来保证唯一标签。
ax = plt.gca()
a = ax.get_legend_handles_labels()
b = {l:h for h,l in zip(*a)}
c = [*zip(*b.items())]
d = c[::-1]
plt.legend(*d)
或者
plt.legend(*[*zip(*{l:h for h,l in zip(*ax.get_legend_handles_labels())}.items())][::-1])
也许不如Matthew Bourque的解决方案易读易记。欢迎进行代码高尔夫。
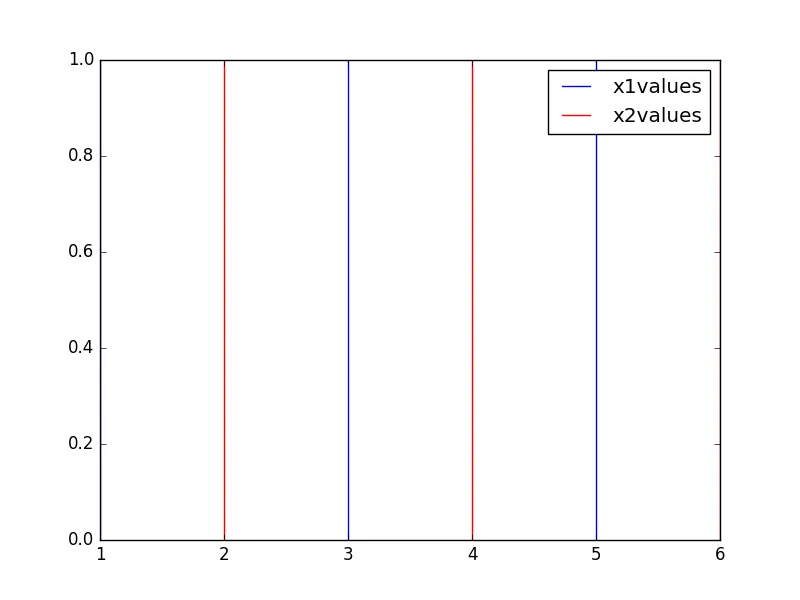
示例
import numpy as np
a = np.random.random((2, 100, 4))
b = np.random.random((2, 100, 4))
import matplotlib.pyplot as plt
fig, ax = plt.subplots(1)
ax.plot(*a, 'C0', label='a')
ax.plot(*b, 'C1', label='b')
ax.legend(*[*zip(*{l:h for h,l in zip(*ax.get_legend_handles_labels())}.items())][::-1])
plt.show()