在ggplot中删除重复的图例标签

9

我希望使用交互作用来创建带有图例子组的绘图,为了创建子标题,我使用了一些零值的虚假数据。

我的样本数据:

library(ggplot2)
df <- data.frame(value = runif(27, 0, 1),
                 x = rep(1:3, each = 3),
                 group1 = rep(c(letters[1:3])),
                 group2 = rep(c("fake", "X", "Y"), each = 9))
# introducing fake data
df[df$group2 == "fake", "value"] <- 0
df$group2 <- relevel(df$group2, ref = "fake")
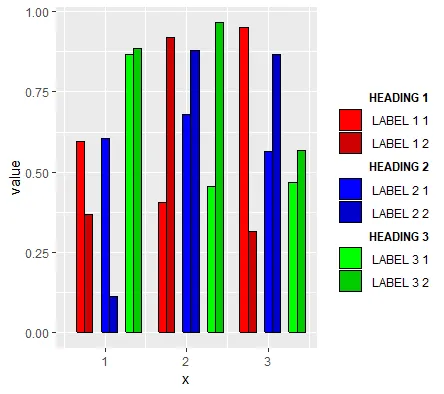
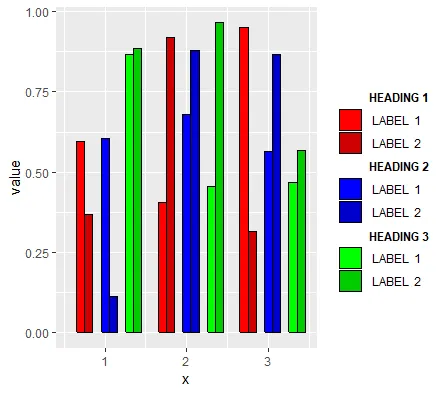
我差点就能创建出期望的图表了:

# labels
lbl1 <- c(expression(bold("HEADING 1")), paste("LABEL 1", 1:2),
          expression(bold("HEADING 2")), paste("LABEL 2", 1:2),
          expression(bold("HEADING 3")), paste("LABEL 3", 1:2))
fills <- c("white", "red1", "red3",
           "white", "blue1", "blue3",
           "white", "green1", "green3")
colo <- c("white", "black", "black",
          "white", "black", "black",
          "white", "black", "black")

ggplot(df, aes(x = x, y = value,
               fill = interaction(group2, group1), 
               colour = interaction(group2, group1))) +
  geom_col(position = "dodge") +
  scale_fill_manual("", values = fills, label = lbl1)  +
  scale_colour_manual("", values = colo, label = lbl1)
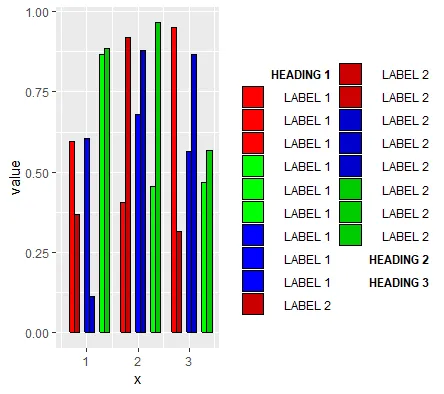
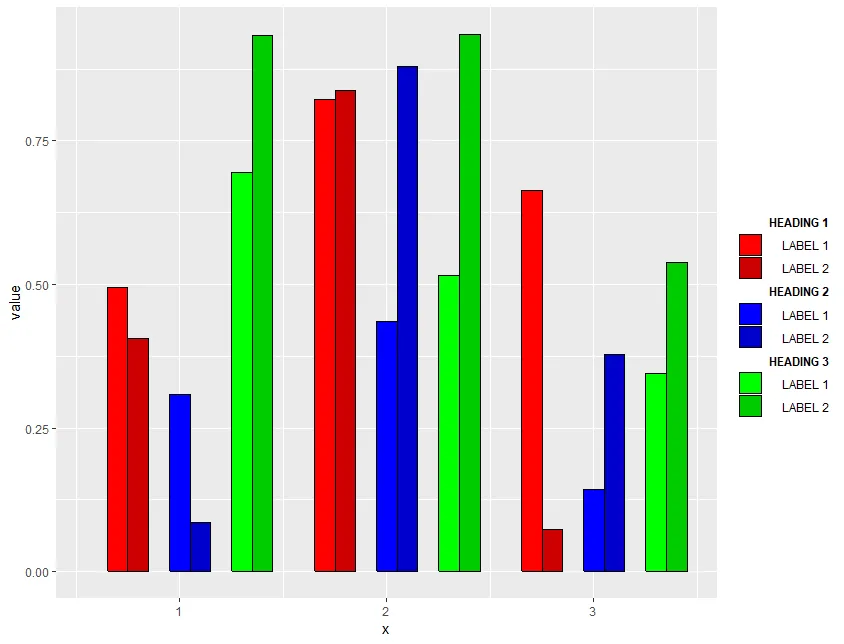
enter image description here

然而,我不希望在子组中出现类似LABEL 1 1LABEL 1 2等的标签,我想只有LABEL 1LABEL 2
在指定这样的标签时,我无法创建这样的绘图:
lbl2 <- c(expression(bold("HEADING 1")), paste("LABEL", 1:2),
          expression(bold("HEADING 2")), paste("LABEL", 1:2),
          expression(bold("HEADING 3")), paste("LABEL", 1:2))

ggplot(df, aes(x = x, y = value,
               fill = interaction(group2, group1), 
               colour = interaction(group2, group1))) +
  geom_col(position = "dodge") +
  scale_fill_manual("", values = fills, label = lbl2)  +
  scale_colour_manual("", values = colo, label = lbl2)

enter image description here

要明确的是,这是期望的输出结果:

enter image description here


2
据我所知,如果您仅使用
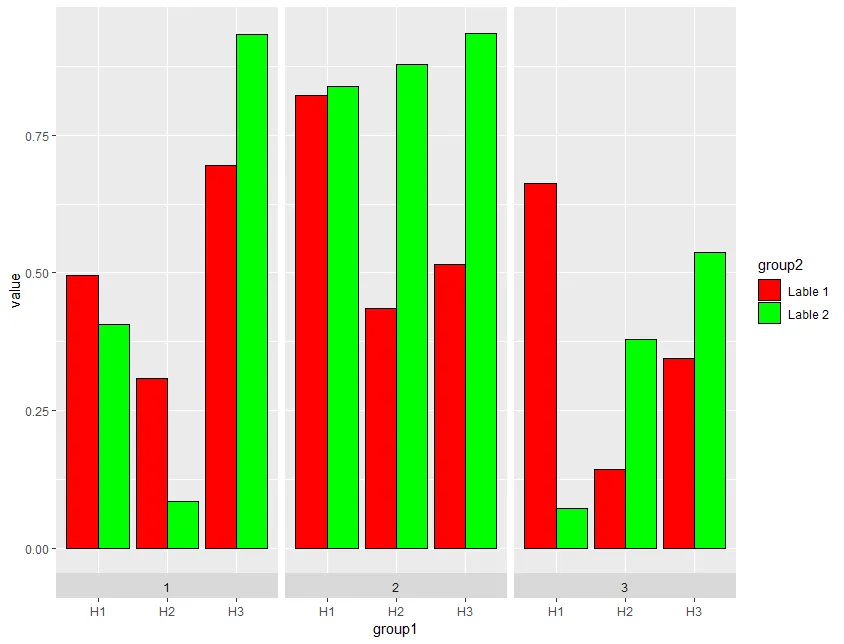
scale_color_manual或仅使用scale_fill_manual,则一切正常,但如果您同时使用两者来制作组合图例,则会出现问题。我不知道为什么会这样。 - aosmith
是的,我也注意到了这一点。我不满意仅使用 scale_color_manual 或仅使用 scale_fill_manual。此外,这似乎并不是 interaction(group2, group1) 的问题,因为创建一个新的因子来组合两个组会导致相同的问题。 - Adela
2
每当我使用非唯一的图例标签与组合的“颜色”和“填充”比例尺时,就会出现奇怪的行为。如果这曾经有效(我猜它确实有效,但还没有检查),那么这可能值得报告为回归/错误。 - aosmith
2个回答

3
您的标签不唯一,因为您引入了一个虚假的组来分离绘图中的列。 根据 discrete_scale 的帮助文档:

给定标签的字符向量(必须与断点长度相同)

比例尺代码可能会调用 unique 来处理字符向量,导致标签少于断点,从而产生奇怪的图例。
似乎您应该使用 facets 来获得类似的结果,而非 hack(虚假组)。
# Remove the "fake" group 2
df1 <- df[df$group2 != "fake",]

ggplot(df1, aes(x = group1, y = value, fill=group2)) +
    geom_col(position = "dodge", color ="black")+
    scale_fill_manual( values =c("red","green"),labels = c("Lable 1", "Lable 2")) +
    scale_x_discrete(labels =c("H1", "H2", "H3")) +
    facet_wrap(x~., strip.position = "bottom")

在这里输入图片描述

如果您真的想得到确切的情节,您需要使用更多技巧修改gtable并更改标签:

library(grid)

fills <- c("white", "red1", "red3",
           "white", "blue1", "blue3",
           "white", "green1", "green3")
# You need the lbl1 in order to get the legend correct placed since it needs
# size of labels.
lbl1 <- c(expression(bold("HEADING 1")), paste("LABEL 1", 1:2),
          expression(bold("HEADING 2")), paste("LABEL 2", 1:2),
          expression(bold("HEADING 3")), paste("LABEL 3", 1:2))
lbl2 <- c(expression(bold("HEADING 1")), paste("LABEL", 1:2),
          expression(bold("HEADING 2")), paste("LABEL", 1:2),
          expression(bold("HEADING 3")), paste("LABEL", 1:2))
 colo <- c("white", "black", "black",
         "white", "black", "black",
         "white", "black", "black")


p <- ggplot(df, aes(x = x, y = value,
                fill = interaction(group2, group1),
                color = interaction(group2, group1))) +
    geom_col(position = "dodge") +
    scale_fill_manual("",values = fills, labels=lbl1)  +
    scale_color_manual("",values = colo, labels=lbl1)

gt <- ggplotGrob(p)

gt
#TableGrob (12 x 11) "layout": 19 grobs
#z         cells       name                                            grob
#1   0 ( 1-12, 1-11) background               rect[plot.background..rect.16164]
# ...
#14 13 ( 7- 7, 7- 7)     ylab-r                                  zeroGrob[NULL]
#15 14 ( 7- 7, 9- 9)  guide-box                               gtable[guide-box]
#16 15 ( 4- 4, 5- 5)   subtitle         zeroGrob[plot.subtitle..zeroGrob.16160]
# ...

# We want the item 15 guide-box
gt$grobs[[15]]$grobs
#21 21 ( 4- 4, 4- 4)   label-3-3             gTree[GRID.gTree.11993]
#22 22 ( 5- 5, 4- 4)   label-4-3             gTree[GRID.gTree.11994]
#23 23 ( 6- 6, 4- 4)   label-5-3             gTree[GRID.gTree.11995]
#24 24 ( 7- 7, 4- 4)   label-6-3             gTree[GRID.gTree.11996]
#25 25 ( 8- 8, 4- 4)   label-7-3             gTree[GRID.gTree.11997]
#26 26 ( 9- 9, 4- 4)   label-8-3             gTree[GRID.gTree.11998]
#27 27 (10-10, 4- 4)   label-9-3             gTree[GRID.gTree.11999]
#28 28 (11-11, 4- 4)  label-10-3             gTree[GRID.gTree.12000]
#29 29 (12-12, 4- 4)  label-11-3             gTree[GRID.gTree.12001]

# Items 21 to 29 are labels, replace the labels with the ones we want.
for(i in 1:9)
{
  gt$grobs[[15]]$grobs[[1]]$grobs[[20 +i]]$children[[1]]$children[[1]]$label <- lbl2[i]

}
# New plot
grid.draw(gt)

enter image description here


感谢您的回复。然而,您的方法与直接使用lbl2标签绘图没有区别。我想要白色填充并且为虚假数据着色。对于我来说,使用facets不太合适,因为我在原始图中使用它们来表示其他组。 - Adela
@Adela,你只需要添加 scale_color_manual 就可以得到与 OP 上最后一个图表完全相同的效果。 - Marcelo
我不明白。请问您能否将此添加到您的答案中,以便查看整个过程? - Adela
这太棒了。谢谢! - Adela

0
以下示例几乎代表了您的最后一张图像,除了条形图周围的黑色边框,但也许对您来说这样也可以接受?

lbl1 <- c(("HEADING 1"), paste("LABEL", 1:2),
          ("HEADING 2"), paste("LABEL", 1:2),
          ("HEADING 3"), paste("LABEL", 1:2))

fills <- c("white", "red1", "red3",
           "white", "blue1", "blue3",
           "white", "green1", "green3")

ggplot(df, aes(x = x, y = value,
               fill = interaction(group2, group1))) +
  geom_col(position = "dodge", show.legend = TRUE) +
  scale_fill_manual(values = fills, label = lbl1) +
  theme(legend.title = element_blank())

谢谢您的回答。不幸的是,这并不是在需要结合scale_colour_manualscale_fill_manual的情况下的解决方案。 - Adela

网页内容由stack overflow 提供, 点击上面的
可以查看英文原文,
原文链接