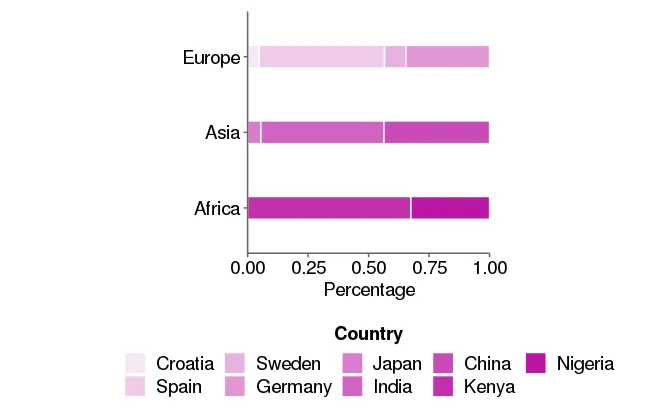
我注意到每个大洲的国家数量不同。
ggplot() 可以按行或列填充图例矩阵,但我从未见过有不同行/列中单元格数量不同的不规则矩阵。
尽管如此,仍然可以通过一些方法来“欺骗”看起来像是一个不规则的图例矩阵。以下是一些实现方法。如果您想按特定顺序排序大洲/国家标签,或者改变图例键之间的间距等参数,则可能需要调整参数。
准备工作:
scale_fill_country <-
scale_fill_manual(labels = dt[, country],
values = (grDevices::colorRampPalette(c('#BB16A3', '#f8e7f5')))(9))
gg.plot <- ggplot(data = dt,
aes(x = continent, y = value, fill = as.factor(number))) +
geom_col(position = "fill", color='white', width=0.3 ) +
labs(x = '', y = 'Percentage') +
scale_y_continuous(expand=c(0,0)) +
scale_fill_country +
theme_classic() +
theme(legend.position = "none") +
coord_flip()
修改图例数据源:
library(dplyr)
dt.legend <- dt %>%
group_by(continent) %>%
arrange(country) %>%
mutate(country.id = seq(1, n())) %>%
ungroup() %>%
tidyr::complete(continent, country.id, fill = list(country = " ")) %>%
rowwise() %>%
mutate(country = ifelse(country == " ",
paste0(rep.int(" ", country.id), collapse = ""),
country)) %>%
ungroup() %>%
mutate(country = forcats::fct_reorder(country, country.id))
> dt.legend
continent country.id country value number
<chr> <int> <fct> <dbl> <int>
1 Africa 1 Kenya 2.02 2
2 Africa 2 Nigeria 7.17 1
3 Africa 3 " " NA NA
4 Africa 4 " " NA NA
5 Asia 1 China 3.21 3
6 Asia 2 India 5.59 4
7 Asia 3 Japan 9.31 5
8 Asia 4 " " NA NA
9 Europe 1 Croatia 0.0131 9
10 Europe 2 Germany 0.0775 6
11 Europe 3 Spain 3.98 8
12 Europe 4 Sweden 0.703 7
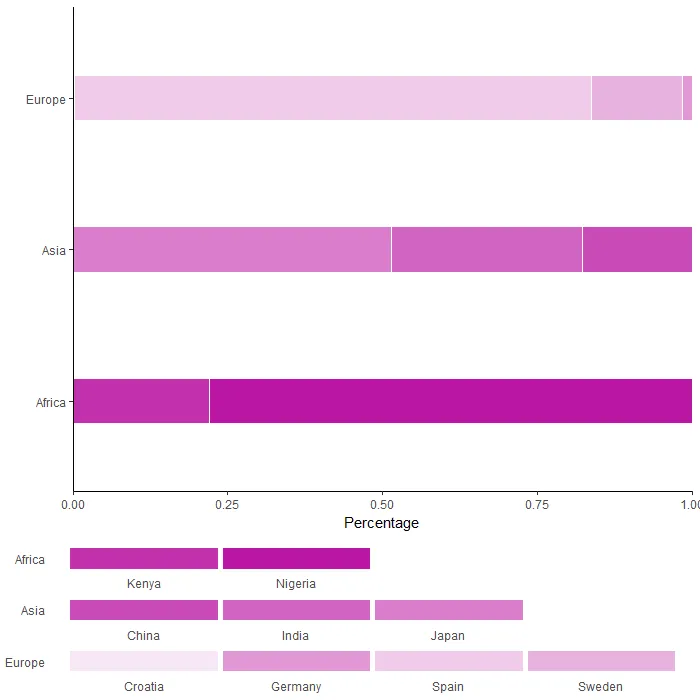
版本1:每个行中包含一个大陆,图例键下方的标签(下方)(如果您不想显示与每行相关联的大陆标签,请在theme()中添加axis.text.y = element_blank())。
gg.legend.rows1 <- ggplot(data = dt.legend,
                         aes(x = country, y = continent,
                             fill = as.factor(number))) +
  geom_tile(color = "white", size = 2) +
  facet_wrap(~ continent, scales = "free", ncol = 1) +
  scale_y_discrete(expand = c(0, 0)) +
  scale_fill_country +
  theme_minimal() +
  theme(axis.title = element_blank(),
        strip.text = element_blank(),
        panel.grid = element_blank(),
        legend.position = "none")

cowplot::plot_grid(gg.plot, gg.legend.rows1,
                   ncol = 1,
                   rel_heights = c(1, 0.3))
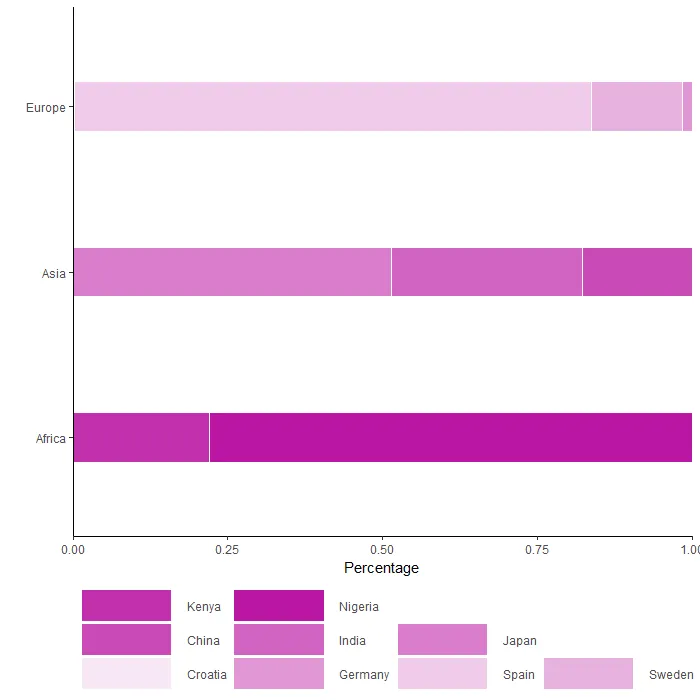
版本2:每个大洲都在一行中,图例键的标签位于右侧(我想不出一种方法将大洲标签放入此方法中,但我认为这在问题中并不需要...)
gg.legend.rows2 <- ggplot(data = dt.legend,
       aes(x = "", y = country, fill = as.factor(number))) +
  geom_tile() +
  scale_y_discrete(position = "right", expand = c(0, 0)) +
  facet_wrap(~ interaction(continent, country, lex.order = TRUE),
             scales = "free") +
  scale_fill_country +
  theme_minimal() +
  theme(axis.title = element_blank(),
        axis.text.x = element_blank(),
        strip.text = element_blank(),
        panel.grid = element_blank(),
        panel.spacing = unit(0, "pt"),
        legend.position = "none")

cowplot::plot_grid(gg.plot, gg.legend.rows2,
                   axis = "l", align = "v",
                   ncol = 1,
                   rel_heights = c(1, 0.2))
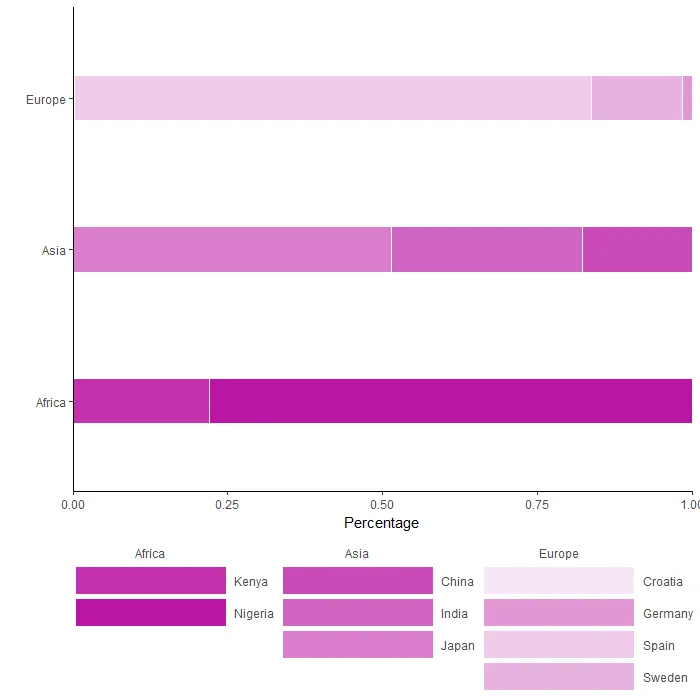
版本 3: 每个大陆在一个列中,图例键的标签在右边(如果不想显示每个列关联的大陆标签,请将axis.text.x = element_blank()添加到theme()中)。
gg.legend.columns <- ggplot(data = dt.legend,
                            aes(x = continent, y = forcats::fct_rev(country),
                                fill = as.factor(number))) +
  geom_tile(color = "white", size = 2) +
  facet_wrap(~ continent, scales = "free", nrow = 1) +
  scale_x_discrete(position = "top", expand = c(0, 0)) +
  scale_y_discrete(position = "right", expand = c(0, 0)) +
  scale_fill_country +
  theme_minimal() +
  theme(axis.title = element_blank(),
        strip.text = element_blank(),
        panel.grid = element_blank(),
        legend.position = "none")

cowplot::plot_grid(gg.plot, gg.legend.columns,
                   axis = "l", align = "v",
                   ncol = 1,
                   rel_heights = c(1, 0.3))