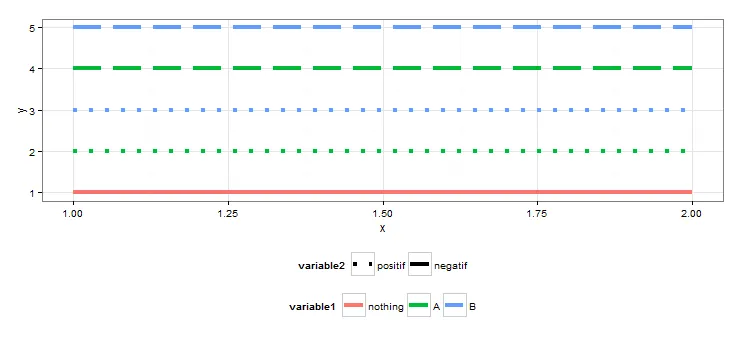
我正在使用R中的ggplot2,手动设置了颜色(variable1)和线型(variable2)的比例尺。其中一个级别适用于两种类型,并且我只希望它以普通线条的形式出现,因此从variable2图例中消失。
请参见下面的最小代码。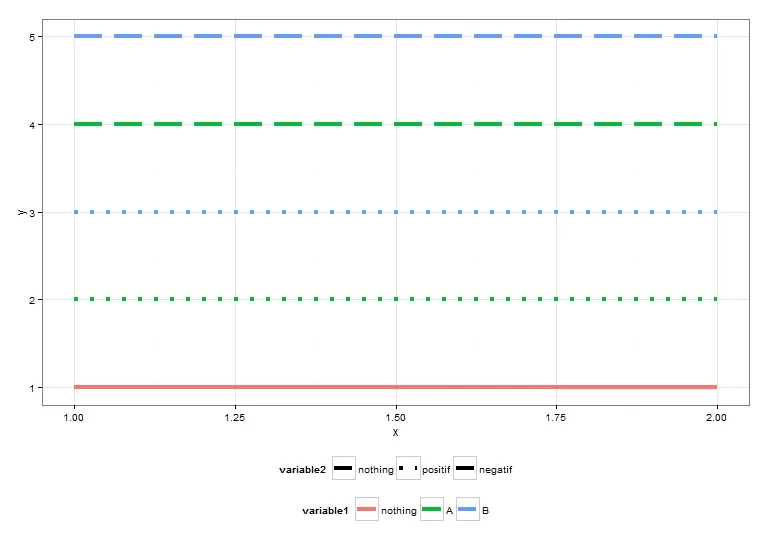
请参见下面的最小代码。
require(ggplot2)

data_0 <- expand.grid(x=1:2,
    variable1=c("nothing", "A", "B"),
    variable2=c("nothing", "positif", "negatif")
)
data <- subset(data_0, !((variable1=="nothing" & variable2 != "nothing") |
    (variable2=="nothing" & variable1 != "nothing")))
data$y <- rep(1:5, each = 2)

ggplot(data=data, aes(x=x, y=y, colour = variable1, lty = variable2))+
    geom_line(size=1.5)+
    theme_bw()+
    theme(legend.position="bottom")+
    scale_linetype_manual(values = c(1,3,5))