我正在寻找一种方法来包含一个(基于matplotlib库)描述散点图中的点大小的图例,因为这可能与另一个变量有关,就像这个基本示例中的情况:
import numpy as np
import matplotlib.pyplot as plt

N = 50
x = np.random.rand(N)
y = np.random.rand(N)
a2 = 400*np.random.rand(N)

plt.scatter(x, y, s=a2, alpha=0.5)
plt.show()
因此,在图例中,理想情况下应该有几个点对应于大小为0-400(变量
a2),根据scatter中的s描述符。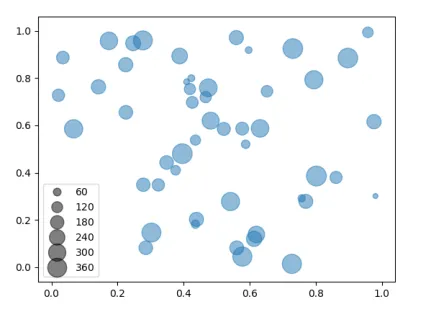
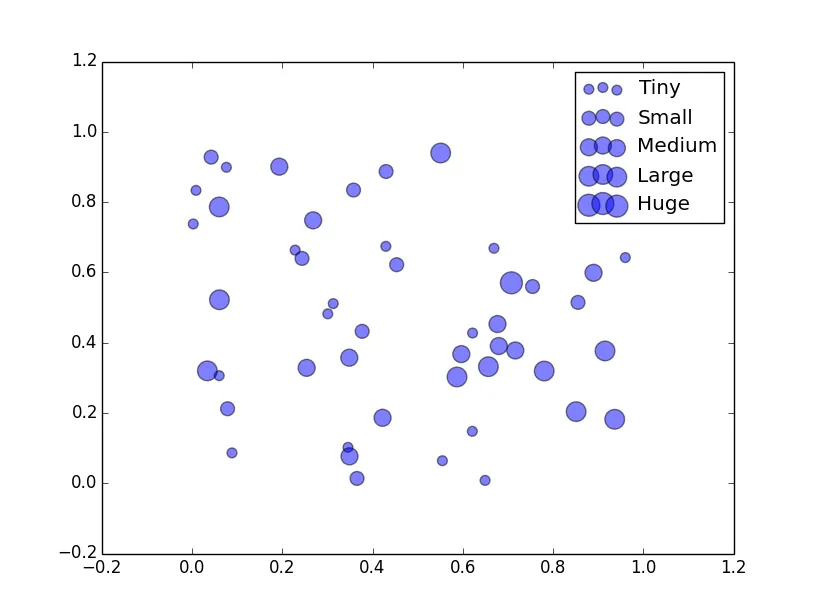
    labels = ["< 5000", "< 20000", " <50000", "> 50000"]
    legend = ax.legend(handles, labels, loc="upper right", title="Sizes")```
- AkariYukari