我正在使用matplotlib制作一些带有图例的散点图。由于标记大小很小,因此在图例句柄中仅绘制少量示例点将很难看到。相反,我想将图例句柄格式化为类似于微小散点图的外观(即,点的小圆形云)。
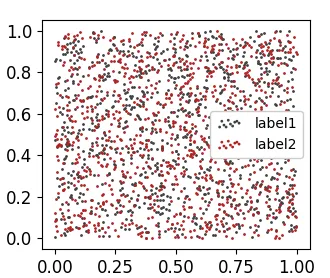
我知道可以在调用图例时更改scatterpoints关键字(如下面的图和代码),这有点符合我的要求,但是句柄似乎沿着半水平线分组,而我希望它们看起来更加随机。
我知道可以在调用图例时更改scatterpoints关键字(如下面的图和代码),这有点符合我的要求,但是句柄似乎沿着半水平线分组,而我希望它们看起来更加随机。
我已经寻找了另一个涉及此主题的线程,但没有太多运气。我知道这将涉及创建自定义艺术家,而这个线程提供了一些见解:如何在matplotlib中制作自定义图例。
非常感谢您的任何帮助。
import matplotlib.pyplot as mp
import numpy

a = numpy.random.rand(1000)
b = numpy.random.rand(1000)
c = numpy.random.rand(1000)
d = numpy.random.rand(1000)

fontsize=12
fig = mp.figure(figsize=(3,3))
ax = fig.add_subplot(111)
ax.scatter(a, b, color='0.25', s=1, label='label1')
ax.scatter(c, d, color='firebrick', s=1, label='label2')
ax.tick_params(labelsize=fontsize)

handles, labels = ax.get_legend_handles_labels()
leg = ax.legend(handles, labels, fontsize=fontsize, scatterpoints=10, bbox_to_anchor=(1.03,1.0), bbox_transform=ax.transAxes, loc='upper left', borderaxespad=0, labelspacing=0.25, fancybox=False, edgecolor='0', framealpha=0, borderpad=0.25, handletextpad=0.5, markerscale=1, handlelength=0)