我正在寻找一个Python包,可以提供自定义平滑系数的选项来适应自然平滑样条。是否有相应的实现?如果没有,如何使用已有的工具自己实现?
所谓自然样条,是指拟合函数在端点处的二阶导数为0(线性)的条件。
所谓平滑样条,是指样条不必“插值”(穿过所有的数据点)。我希望自己决定正确的平滑系数λ(请参见维基百科页面关于平滑样条的介绍)。
我正在寻找一个Python包,可以提供自定义平滑系数的选项来适应自然平滑样条。是否有相应的实现?如果没有,如何使用已有的工具自己实现?
所谓自然样条,是指拟合函数在端点处的二阶导数为0(线性)的条件。
所谓平滑样条,是指样条不必“插值”(穿过所有的数据点)。我希望自己决定正确的平滑系数λ(请参见维基百科页面关于平滑样条的介绍)。
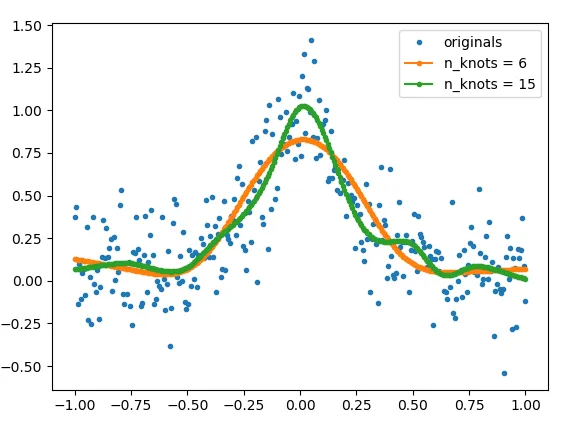
get_natural_cubic_spline_model),并展示如何使用它。可以通过使用不同数量的节点来控制拟合的平滑度。用户还可以指定节点的位置。
from matplotlib import pyplot as plt
import numpy as np

def func(x):
    return 1/(1+25*x**2)

# make example data
x = np.linspace(-1,1,300)
y = func(x) + np.random.normal(0, 0.2, len(x))

# The number of knots can be used to control the amount of smoothness
model_6 = get_natural_cubic_spline_model(x, y, minval=min(x), maxval=max(x), n_knots=6)
model_15 = get_natural_cubic_spline_model(x, y, minval=min(x), maxval=max(x), n_knots=15)
y_est_6 = model_6.predict(x)
y_est_15 = model_15.predict(x)


plt.plot(x, y, ls='', marker='.', label='originals')
plt.plot(x, y_est_6, marker='.', label='n_knots = 6')
plt.plot(x, y_est_15, marker='.', label='n_knots = 15')
plt.legend(); plt.show()
import numpy as np
import pandas as pd
from sklearn.base import BaseEstimator, TransformerMixin
from sklearn.linear_model import LinearRegression
from sklearn.pipeline import Pipeline


def get_natural_cubic_spline_model(x, y, minval=None, maxval=None, n_knots=None, knots=None):
    """
    Get a natural cubic spline model for the data.

    For the knots, give (a) `knots` (as an array) or (b) minval, maxval and n_knots.

    If the knots are not directly specified, the resulting knots are equally
    space within the *interior* of (max, min).  That is, the endpoints are
    *not* included as knots.

    Parameters
    ----------
    x: np.array of float
        The input data
    y: np.array of float
        The outpur data
    minval: float
        Minimum of interval containing the knots.
    maxval: float
        Maximum of the interval containing the knots.
    n_knots: positive integer
        The number of knots to create.
    knots: array or list of floats
        The knots.

    Returns
    --------
    model: a model object
        The returned model will have following method:
        - predict(x):
            x is a numpy array. This will return the predicted y-values.
    """

    if knots:
        spline = NaturalCubicSpline(knots=knots)
    else:
        spline = NaturalCubicSpline(max=maxval, min=minval, n_knots=n_knots)

    p = Pipeline([
        ('nat_cubic', spline),
        ('regression', LinearRegression(fit_intercept=True))
    ])

    p.fit(x, y)

    return p


class AbstractSpline(BaseEstimator, TransformerMixin):
    """Base class for all spline basis expansions."""

    def __init__(self, max=None, min=None, n_knots=None, n_params=None, knots=None):
        if knots is None:
            if not n_knots:
                n_knots = self._compute_n_knots(n_params)
            knots = np.linspace(min, max, num=(n_knots + 2))[1:-1]
            max, min = np.max(knots), np.min(knots)
        self.knots = np.asarray(knots)

    @property
    def n_knots(self):
        return len(self.knots)

    def fit(self, *args, **kwargs):
        return self


class NaturalCubicSpline(AbstractSpline):
    """Apply a natural cubic basis expansion to an array.
    The features created with this basis expansion can be used to fit a
    piecewise cubic function under the constraint that the fitted curve is
    linear *outside* the range of the knots..  The fitted curve is continuously
    differentiable to the second order at all of the knots.
    This transformer can be created in two ways:
      - By specifying the maximum, minimum, and number of knots.
      - By specifying the cutpoints directly.

    If the knots are not directly specified, the resulting knots are equally
    space within the *interior* of (max, min).  That is, the endpoints are
    *not* included as knots.
    Parameters
    ----------
    min: float
        Minimum of interval containing the knots.
    max: float
        Maximum of the interval containing the knots.
    n_knots: positive integer
        The number of knots to create.
    knots: array or list of floats
        The knots.
    """

    def _compute_n_knots(self, n_params):
        return n_params

    @property
    def n_params(self):
        return self.n_knots - 1

    def transform(self, X, **transform_params):
        X_spl = self._transform_array(X)
        if isinstance(X, pd.Series):
            col_names = self._make_names(X)
            X_spl = pd.DataFrame(X_spl, columns=col_names, index=X.index)
        return X_spl

    def _make_names(self, X):
        first_name = "{}_spline_linear".format(X.name)
        rest_names = ["{}_spline_{}".format(X.name, idx)
                      for idx in range(self.n_knots - 2)]
        return [first_name] + rest_names

    def _transform_array(self, X, **transform_params):
        X = X.squeeze()
        try:
            X_spl = np.zeros((X.shape[0], self.n_knots - 1))
        except IndexError: # For arrays with only one element
            X_spl = np.zeros((1, self.n_knots - 1))
        X_spl[:, 0] = X.squeeze()

        def d(knot_idx, x):
            def ppart(t): return np.maximum(0, t)

            def cube(t): return t*t*t
            numerator = (cube(ppart(x - self.knots[knot_idx]))
                         - cube(ppart(x - self.knots[self.n_knots - 1])))
            denominator = self.knots[self.n_knots - 1] - self.knots[knot_idx]
            return numerator / denominator

        for i in range(0, self.n_knots - 2):
            X_spl[:, i+1] = (d(i, X) - d(self.n_knots - 2, X)).squeeze()
        return X_spl
import numpy as np
import matplotlib.pyplot as plt
import csaps
np.random.seed(1234)
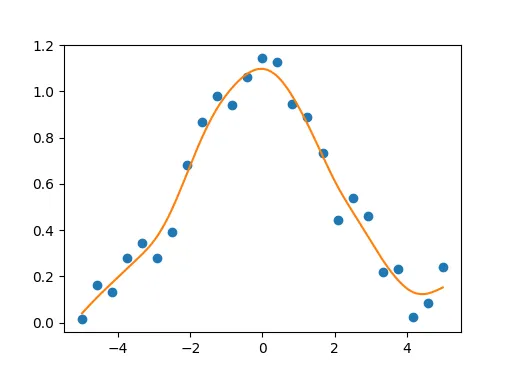
x = np.linspace(-5., 5., 25)
y = np.exp(-(x/2.5)**2) + (np.random.rand(25) - 0.2) * 0.3
sp = csaps.UnivariateCubicSmoothingSpline(x, y, smooth=0.85)
xs = np.linspace(x[0], x[-1], 150)
ys = sp(xs)
plt.plot(x, y, 'o', xs, ys, '-')
plt.show()
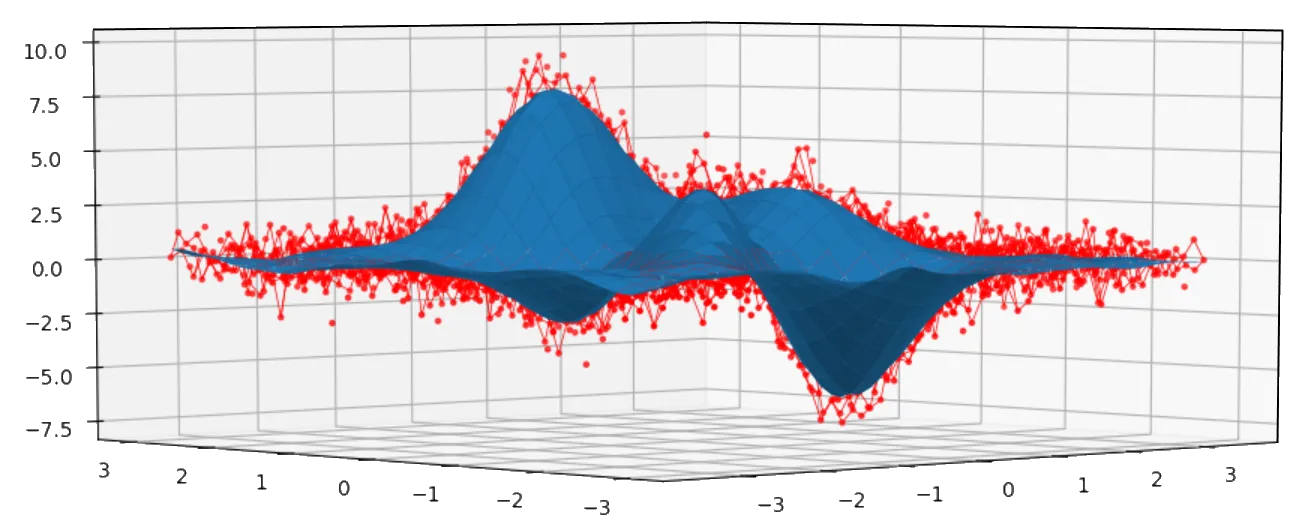
双变量示例:
import numpy as np

import matplotlib.pyplot as plt
from mpl_toolkits.mplot3d import Axes3D

import csaps

xdata = [np.linspace(-3, 3, 61), np.linspace(-3.5, 3.5, 51)]
i, j = np.meshgrid(*xdata, indexing='ij')

ydata = (3 * (1 - j)**2. * np.exp(-(j**2) - (i + 1)**2)
         - 10 * (j / 5 - j**3 - i**5) * np.exp(-j**2 - i**2)
         - 1 / 3 * np.exp(-(j + 1)**2 - i**2))

np.random.seed(12345)
noisy = ydata + (np.random.randn(*ydata.shape) * 0.75)

sp = csaps.MultivariateCubicSmoothingSpline(xdata, noisy, smooth=0.988)
ysmth = sp(xdata)

fig = plt.figure()
ax = fig.add_subplot(111, projection='3d')

ax.plot_wireframe(j, i, noisy, linewidths=0.5, color='r')
ax.scatter(j, i, noisy, s=5, c='r')

ax.plot_surface(j, i, ysmth, linewidth=0, alpha=1.0)

plt.show()
csaps 看起来很不错!需要注意的一件事是,在至少 v.0.11.0 中,csaps.csaps() 需要唯一的 x 值。最终我添加了一个预处理步骤,计算非唯一 x 值的平均值。 - Niko Pasanenxs = u(x), ys = v(y)。 - irolnAttributeError: module 'csaps' has no attribute 'MultivariateCubicSmoothingSpline',但我找不到原因! - sampatsy是一个Python包,其中包含有生成样条基函数的功能,其中包括一个自然立方样条基函数。在文档中有详细介绍。
然后可以使用任何库来适配模型,例如scikit-learn或statsmodels。
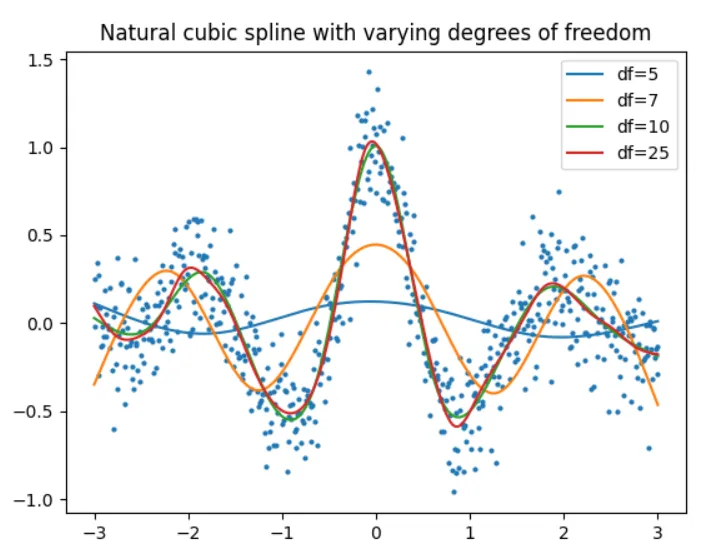
cr()函数的df参数可用于控制“平滑度”。df可能导致欠拟合(见下文)。以下是使用scikit-learn的简单示例。
import numpy as np
from sklearn.linear_model import LinearRegression
from patsy import cr
import matplotlib.pyplot as plt

n_obs = 600
np.random.seed(0)
x = np.linspace(-3, 3, n_obs)
y = 1 / (x ** 2 + 1) * np.cos(np.pi * x) + np.random.normal(0, 0.2, size=n_obs)


def plot_smoothed(df=5):

    # Generate spline basis with different degrees of freedom
    x_basis = cr(x, df=df, constraints="center")

    # Fit model to the data
    model = LinearRegression().fit(x_basis, y)

    # Get estimates
    y_hat = model.predict(x_basis)

    plt.plot(x, y_hat, label=f"df={df}")


plt.scatter(x, y, s=4, color="tab:blue")

for df in (5, 7, 10, 25):
    plot_smoothed(df)

plt.legend()
plt.title(f"Natural cubic spline with varying degrees of freedom")
plt.show()
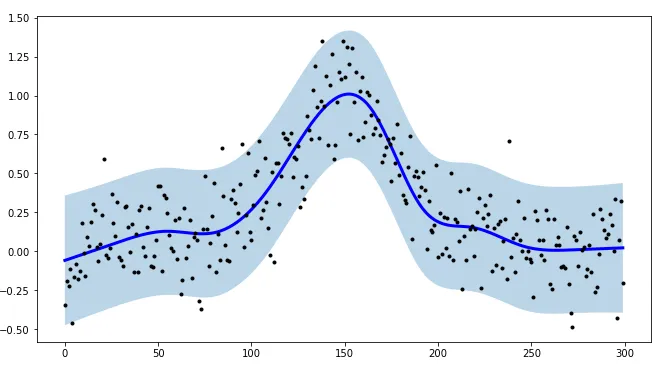
SplineSmoother情况下:import numpy as np
import matplotlib.pyplot as plt
from tsmoothie.smoother import *
def func(x):
return 1/(1+25*x**2)
# make example data
x = np.linspace(-1,1,300)
y = func(x) + np.random.normal(0, 0.2, len(x))
# operate smoothing
smoother = SplineSmoother(n_knots=10, spline_type='natural_cubic_spline')
smoother.smooth(y)
# generate intervals
low, up = smoother.get_intervals('prediction_interval', confidence=0.05)
# plot the first smoothed timeseries with intervals
plt.figure(figsize=(11,6))
plt.plot(smoother.smooth_data[0], linewidth=3, color='blue')
plt.plot(smoother.data[0], '.k')
plt.fill_between(range(len(smoother.data[0])), low[0], up[0], alpha=0.3)
rpy2在Python中使用R函数:import rpy2.robjects as robjects
r_y = robjects.FloatVector(y_train)
r_x = robjects.FloatVector(x_train)
r_smooth_spline = robjects.r['smooth.spline'] #extract R function# run smoothing function
spline1 = r_smooth_spline(x=r_x, y=r_y, spar=0.7)
ySpline=np.array(robjects.r['predict'](spline1,robjects.FloatVector(x_smooth)).rx2('y'))
plt.plot(x_smooth,ySpline)
lambda:spline1 = r_smooth_spline(x=r_x, y=r_y, lambda=42)是无效的,因为在Python中lambda已经有另外一个含义,但有一个解决方案:如何在RPy中使用smooth.spline的lambda参数而不让Python将其解释为lambda。x_train和y_train,如果您想在Full-HD分辨率下将其绘制在-3到5之间,则可以定义x_smooth=np.array(np.linspace(-3,5,1920))。!pip install -Iv rpy2==3.4.2,具体操作请参考NotImplementedError: Conversion 'rpy2py' not defined for objects of type '<class 'rpy2.rinterface.SexpClosure'>' only after I run the code twice。请注意,在运行代码两次后才能执行此操作。