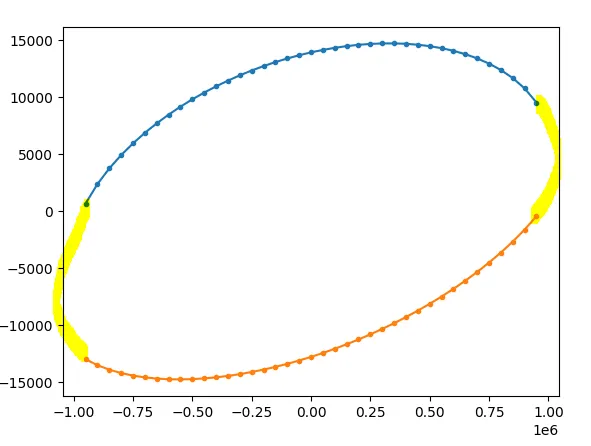
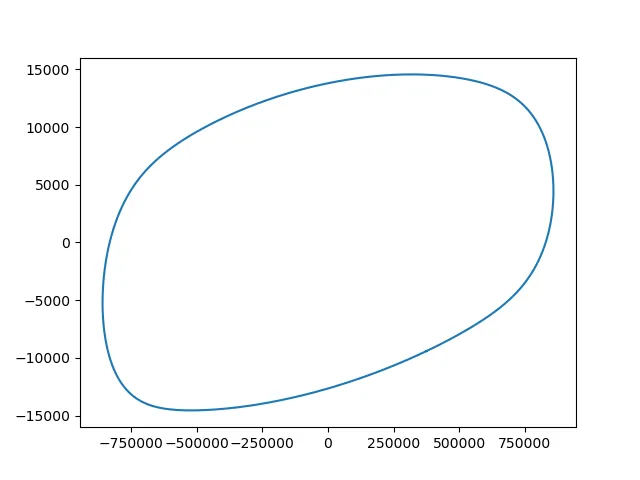
我有一段简单的代码,可以可视化两条曲线,这两条曲线具有相同的X值和两个带有正负值的Y数组。现在我需要像图片上画的那样,连接这两条曲线,使其像一条样条曲线一样,跟随蓝色和黄色曲线的曲率。是否有简单的方法来实现这个目标?
import matplotlib.pyplot as plt
import numpy as np

x = np.array([-950000, -900000, -850000, -800000, -750000, -700000, -650000, -600000, -550000, -500000, -450000, -400000, -350000, -300000, -250000, -200000, -150000, -100000, -50000, 0, 50000, 100000, 150000, 200000, 250000, 300000, 350000, 400000, 450000, 500000, 550000, 600000, 650000, 700000, 750000, 800000, 850000, 900000, 950000])
y1 = np.array([685.481345431417, 2391.45045349584, 3763.65199801249, 4934.71155184779, 5964.6281633323, 6886.68942095237, 7721.64396971495, 8483.43931582653, 9181.95597885273, 9824.46283102861, 10416.4566504407, 10962.1768884869, 11464.9365796457, 11927.3430475099, 12351.4493057019, 12738.8599980436, 13090.8063291572, 13408.199001938, 13691.664885911, 13941.5710485039, 14158.0383746211, 14340.9459793581, 14489.9267952872, 14604.3539528837, 14683.316749252, 14725.5839797701, 14729.5510006159, 14693.1647981672, 14613.818048831, 14488.1977181289, 14312.0643546631, 14079.9211803469, 13784.4993229454, 13415.9182628928, 12960.2304939828, 12396.6873712083, 11692.001306083, 10786.1732502764, 9546.577630922])
y2 = np.array([-12964.9917681513, -13484.2810625493, -13877.7293703977, -14176.0965854394, -14398.3755688971, -14557.2630225465, -14661.7287514643, -14718.3694106679, -14732.1838012106, -14707.0458689977, -14646.0078962048, -14551.5026355371, -14425.4823640491, -14269.5169290554, -14084.8641625319, -13872.5210520821, -13633.261072224, -13367.661223979, -13076.1211318486, -12758.875739645, -12416.0025738568, -12047.4241079955, -11652.9053982488, -11232.0468201151, -10784.2713725731, -10308.8055811049, -9804.65245810687, -9270.55417160323, -8704.94087427911, -8105.86028908029, -7470.87966330147, -6796.94671476701, -6080.1874975716, -5315.60321066213, -4496.59719902091, -3614.1996575715, -2655.71388453809, -1602.14701869796, -422.739166308134])

plt.plot(x, y1, marker='.')
plt.plot(x,y2, marker='.')
plt.show()