我有一个庞大的数组,其中包含描述三维曲线的坐标,约20000个点。我正试图通过忽略一些点,例如每两个点中取1个点的方式来使用更少的点。当我这样做并绘制减少数量的点时,形状看起来相同。但是我想适当比较这两条曲线,类似于卡方检验,以查看减小的图形与原始图形相差多少。
是否有一种简单内置的方法来做到这一点,或者是否有任何思路可以解决这个问题。
是否有一种简单内置的方法来做到这一点,或者是否有任何思路可以解决这个问题。
def normed_distance_along_path( polyline ):
polyline = np.asarray(polyline)
distance = np.cumsum( np.sqrt(np.sum( np.diff(polyline, axis=1)**2, axis=0 )) )
return np.insert(distance, 0, 0)/distance[-1]
def average_distance_between_polylines(xy1, xy2):
s1 = normed_distance_along_path(xy1)
s2 = normed_distance_along_path(xy2)
interpol_xy1 = interp1d( s1, xy1 )
xy1_on_2 = interpol_xy1(s2)
node_to_node_distance = np.sqrt(np.sum( (xy1_on_2 - xy2)**2, axis=0 ))
return node_to_node_distance.mean() # or use the max
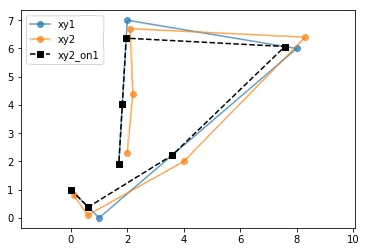
# Two example polyline:
xy1 = [0, 1, 8, 2, 1.7], [1, 0, 6, 7, 1.9] # it should work in 3D too
xy2 = [.1, .6, 4, 8.3, 2.1, 2.2, 2], [.8, .1, 2, 6.4, 6.7, 4.4, 2.3]
average_distance_between_polylines(xy1, xy2) # 0.45004578069119189