如何在Python中拟合高斯曲线?

24

我有一个数组,当我把它绘制出来时,会得到一个带有一些噪声的高斯形状。我想要拟合这个高斯函数。这是我已经尝试过的方法,但是当我用它绘图时,我并没有得到一个拟合好的高斯曲线,而只是得到了一条直线。我已经尝试了很多不同的方法,但是我就是无法搞清楚。

random_sample=norm.rvs(h)

parameters = norm.fit(h)

fitted_pdf = norm.pdf(f, loc = parameters[0], scale = parameters[1])

normal_pdf = norm.pdf(f)

plt.plot(f,fitted_pdf,"green")
plt.plot(f, normal_pdf, "red")
plt.plot(f,h)
plt.show()

这个回答解决了你的问题吗?Python的高斯拟合 - cigien
2个回答

31
您可以按照以下方式使用scipy.stats.norm中的fit
import numpy as np
from scipy.stats import norm
import matplotlib.pyplot as plt

data = np.random.normal(loc=5.0, scale=2.0, size=1000)
mean,std=norm.fit(data)

norm.fit尝试根据数据拟合正态分布的参数。实际上,在上面的示例中,mean约为5,std约为2。

为了绘制它,您可以执行以下操作:

plt.hist(data, bins=30, density=True)
xmin, xmax = plt.xlim()
x = np.linspace(xmin, xmax, 100)
y = norm.pdf(x, mean, std)
plt.plot(x, y)
plt.show()

enter image description here

蓝色方框是您数据的直方图,绿色线条是具有拟合参数的高斯曲线。


24

有很多方法可以将高斯函数拟合到数据集上。我通常在拟合数据时使用astropy,这就是我想把它作为附加答案添加的原因。

我使用一些数据集来模拟带有一些噪声的高斯分布:

import numpy as np
from astropy import modeling

m = modeling.models.Gaussian1D(amplitude=10, mean=30, stddev=5)
x = np.linspace(0, 100, 2000)
data = m(x)
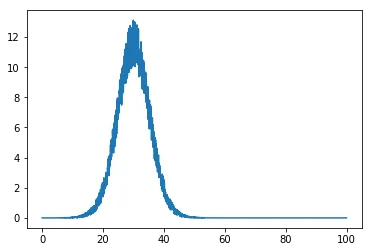
data = data + np.sqrt(data) * np.random.random(x.size) - 0.5
data -= data.min()
plt.plot(x, data)

输入图像描述

那么适配其实非常简单,您只需指定要拟合数据的模型和适配器:

fitter = modeling.fitting.LevMarLSQFitter()
model = modeling.models.Gaussian1D()   # depending on the data you need to give some initial values
fitted_model = fitter(model, x, data)
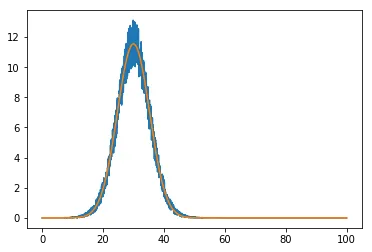
并且绘制:

plt.plot(x, data)
plt.plot(x, fitted_model(x))

enter image description here


但是你也可以只使用Scipy,但你需要自己定义函数:

from scipy import optimize

def gaussian(x, amplitude, mean, stddev):
    return amplitude * np.exp(-((x - mean) / 4 / stddev)**2)

popt, _ = optimize.curve_fit(gaussian, x, data)

这将返回最佳拟合参数,您可以像这样绘制它:

plt.plot(x, data)
plt.plot(x, gaussian(x, *popt))

在此输入图像描述


网页内容由stack overflow 提供, 点击上面的
可以查看英文原文,
原文链接