Python中的Catmull-Rom样条曲线

4
有没有Python库或函数可以从三个点计算Catmull-Rom样条曲线?
最终我需要的是沿着样条曲线等距离地给定一个量t时点的x,y坐标(例如,样条曲线长度为3单位,我想在样条长度为0、1、2和3时得到x,y坐标)。
这并不是什么激动人心的事情。我正在自己编写代码,但如果你找到了一些好的东西,那就很棒,可以用来测试(或节省时间)。
3个回答

10

三个点 ? Catmull-Rom 是定义在四个点上的,例如 p_1 p0 p1 p2; 一个立方曲线从 p0 到 p1,而外部点 p_1 和 p2 确定了 p0 和 p1 的斜率。 要通过数组 P 中的一些点绘制曲线,请执行以下操作:

for j in range( 1, len(P)-2 ):  # skip the ends
    for t in range( 10 ):  # t: 0 .1 .2 .. .9
        p = spline_4p( t/10, P[j-1], P[j], P[j+1], P[j+2] )
        # draw p

def spline_4p( t, p_1, p0, p1, p2 ):
    """ Catmull-Rom
        (Ps can be numpy vectors or arrays too: colors, curves ...)
    """
        # wikipedia Catmull-Rom -> Cubic_Hermite_spline
        # 0 -> p0,  1 -> p1,  1/2 -> (- p_1 + 9 p0 + 9 p1 - p2) / 16
    # assert 0 <= t <= 1
    return (
          t*((2-t)*t - 1)   * p_1
        + (t*t*(3*t - 5) + 2) * p0
        + t*((4 - 3*t)*t + 1) * p1
        + (t-1)*t*t         * p2 ) / 2

一个人可以使用由三个点组成的分段二次曲线--参见Dodgson, Quadratic Interpolation for Image Resampling。你真正想要做什么?


3个实际点,加上最后的斜率两个必要端点 - Stefano Borini
spline_4p(t,p_1,p0,p1,p2)表示从p0到p1的曲线,然后是spline_4p(t,p0,p1,p2,p3)表示从p1到p2的曲线,并且p_1和p3影响斜率。希望对你有帮助? - denis
很好的工作示例!但在t-cycle中,我们应该将t转换为浮点数:p = spline_4p(float(t)/10, P[j-1], P[j], P[j+1], P[j+2]) - alrusdi

3
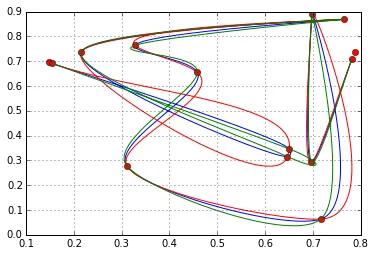
正如之前所提到的,对于Catmull-Rom曲线来说您需要4个点,而端点是一个问题。我正在考虑将它们应用在自然三次样条线之外(在我的应用程序中,潜在的超出已知数据范围的过冲是不切实际的)。与@denis的代码类似,这里有一些可能会对您有所帮助的东西(注意几点:1)该代码只是随机生成点,我相信您可以使用被注释掉的示例来使用您自己的数据。 2)我创建了扩展端点,在第一个/最后两个点之间保留斜率 - 使用域的任意距离的1%。 3)我包括均匀、向心和弦向结参数化以进行比较):Catmull-Rom Python Code Output Example Image
# coding: utf-8

# In[1]:

import numpy
import matplotlib.pyplot as plt
get_ipython().magic(u'pylab inline')


# In[2]:

def CatmullRomSpline(P0, P1, P2, P3, a, nPoints=100):
  """
  P0, P1, P2, and P3 should be (x,y) point pairs that define the Catmull-Rom spline.
  nPoints is the number of points to include in this curve segment.
  """
  # Convert the points to numpy so that we can do array multiplication
  P0, P1, P2, P3 = map(numpy.array, [P0, P1, P2, P3])

  # Calculate t0 to t4
  alpha = a
  def tj(ti, Pi, Pj):
    xi, yi = Pi
    xj, yj = Pj
    return ( ( (xj-xi)**2 + (yj-yi)**2 )**0.5 )**alpha + ti

  t0 = 0
  t1 = tj(t0, P0, P1)
  t2 = tj(t1, P1, P2)
  t3 = tj(t2, P2, P3)

  # Only calculate points between P1 and P2
  t = numpy.linspace(t1,t2,nPoints)

  # Reshape so that we can multiply by the points P0 to P3
  # and get a point for each value of t.
  t = t.reshape(len(t),1)

  A1 = (t1-t)/(t1-t0)*P0 + (t-t0)/(t1-t0)*P1
  A2 = (t2-t)/(t2-t1)*P1 + (t-t1)/(t2-t1)*P2
  A3 = (t3-t)/(t3-t2)*P2 + (t-t2)/(t3-t2)*P3

  B1 = (t2-t)/(t2-t0)*A1 + (t-t0)/(t2-t0)*A2
  B2 = (t3-t)/(t3-t1)*A2 + (t-t1)/(t3-t1)*A3

  C  = (t2-t)/(t2-t1)*B1 + (t-t1)/(t2-t1)*B2
  return C

def CatmullRomChain(P,alpha):
  """
  Calculate Catmull Rom for a chain of points and return the combined curve.
  """
  sz = len(P)

  # The curve C will contain an array of (x,y) points.
  C = []
  for i in range(sz-3):
    c = CatmullRomSpline(P[i], P[i+1], P[i+2], P[i+3],alpha)
    C.extend(c)

  return C


# In[139]:

# Define a set of points for curve to go through
Points = numpy.random.rand(10,2)
#Points=array([array([153.01,722.67]),array([152.73,699.92]),array([152.91,683.04]),array([154.6,643.45]),
#        array([158.07,603.97])])
#Points = array([array([0,92.05330318]),
#               array([2.39580622,29.76345192]),
#               array([10.01564963,16.91470591]),
#               array([15.26219886,71.56301997]),
#               array([15.51234733,73.76834447]),
#               array([24.88468545,50.89432899]),
#               array([27.83934153,81.1341789]),
#               array([36.80443404,56.55810783]),
#               array([43.1404725,16.96946811]),
#               array([45.27824599,15.75903418]),
#               array([51.58871027,90.63583215])])

x1=Points[0][0]
x2=Points[1][0]
y1=Points[0][1]
y2=Points[1][1]
x3=Points[-2][0]
x4=Points[-1][0]
y3=Points[-2][1]
y4=Points[-1][1]
dom=max(Points[:,0])-min(Points[:,0])
rng=max(Points[:,1])-min(Points[:,1])
pctdom=1
pctdom=float(pctdom)/100
prex=x1+sign(x1-x2)*dom*pctdom
prey=(y1-y2)/(x1-x2)*(prex-x1)+y1
endx=x4+sign(x4-x3)*dom*pctdom
endy=(y4-y3)/(x4-x3)*(endx-x4)+y4
print len(Points)
Points=list(Points)
Points.insert(0,array([prex,prey]))
Points.append(array([endx,endy]))
print len(Points)


# In[140]:

#Define alpha
a=0.

# Calculate the Catmull-Rom splines through the points
c = CatmullRomChain(Points,a)

# Convert the Catmull-Rom curve points into x and y arrays and plot
x,y = zip(*c)
plt.plot(x,y,c='green',zorder=10)

a=0.5
c = CatmullRomChain(Points,a)
x,y = zip(*c)
plt.plot(x,y,c='blue')

a=1.
c = CatmullRomChain(Points,a)
x,y = zip(*c)
plt.plot(x,y,c='red')

# Plot the control points
px, py = zip(*Points)
plt.plot(px,py,'o',c='black')

plt.grid(b=True)
plt.show()


# In[141]:

Points


# In[104]:

我还要指出,Catmull-Rom在插值方面有一定的局限性...因为它不是你希望的插值函数:它不会给你一个f(x),而是一个f(t),其中t是两个点之间的距离...以线性距离表示,而不是x、y距离!因此,要获得简单的插值,您必须提供许多“t”,然后可能线性插值这些“t”以获得实际的x、y空间中的点,但您必须小心沿着正确的Catmull-Rom段进行插值。 - Vlox

1
这里有一个链接:jj_catmull,它似乎是用Python编写的,也许你可以在那里找到你需要的内容。

哦哦哦,好闪亮啊!谢谢,我会尽快查看它。它似乎可以满足我的需求,但我需要仔细检查。 - Stefano Borini
不好意思,它强烈依赖 XSi 的东西。:( - Stefano Borini
这个链接似乎已经失效。 - Astariul

网页内容由stack overflow 提供, 点击上面的
可以查看英文原文,
原文链接