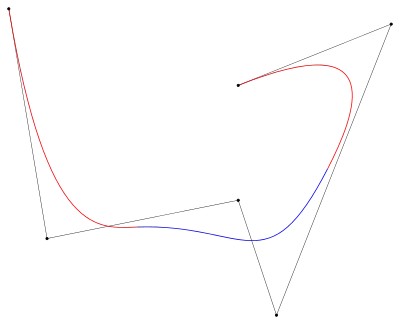
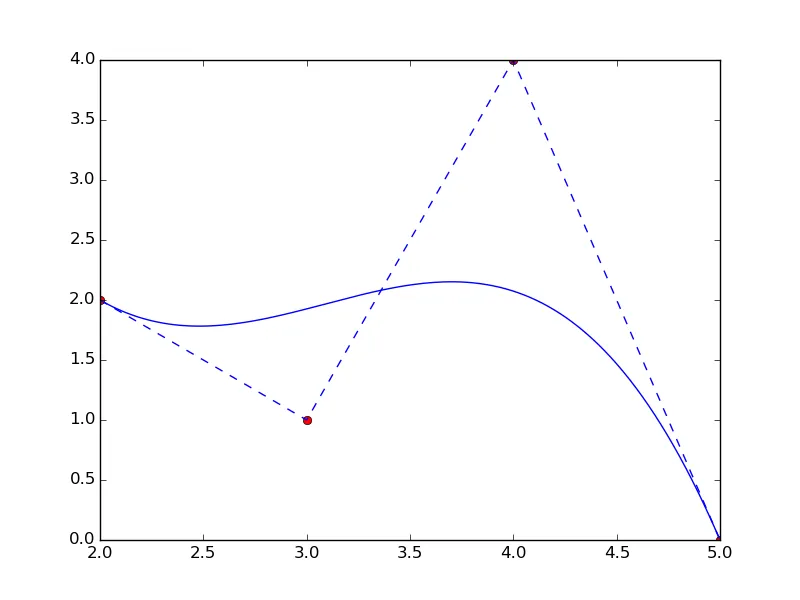
我正在尝试做类似以下的事情(图片来自维基百科)
#!/usr/bin/env python
from scipy import interpolate
import numpy as np
import matplotlib.pyplot as plt
# sampling
x = np.linspace(0, 10, 10)
y = np.sin(x)
# spline trough all the sampled points
tck = interpolate.splrep(x, y)
x2 = np.linspace(0, 10, 200)
y2 = interpolate.splev(x2, tck)
# spline with all the middle points as knots (not working yet)
# knots = x[1:-1] # it should be something like this
knots = np.array([x[1]]) # not working with above line and just seeing what this line does
weights = np.concatenate(([1],np.ones(x.shape[0]-2)*.01,[1]))
tck = interpolate.splrep(x, y, t=knots, w=weights)
x3 = np.linspace(0, 10, 200)
y3 = interpolate.splev(x2, tck)
# plot
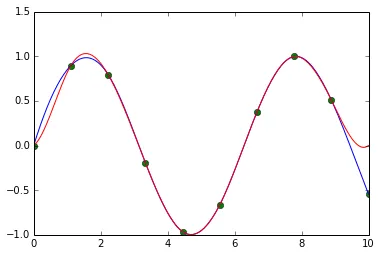
plt.plot(x, y, 'go', x2, y2, 'b', x3, y3,'r')
plt.show()
这段代码的第一部分是从主要参考文献中提取的代码,但没有解释如何使用点作为控制节点。
该代码的结果是以下图像。
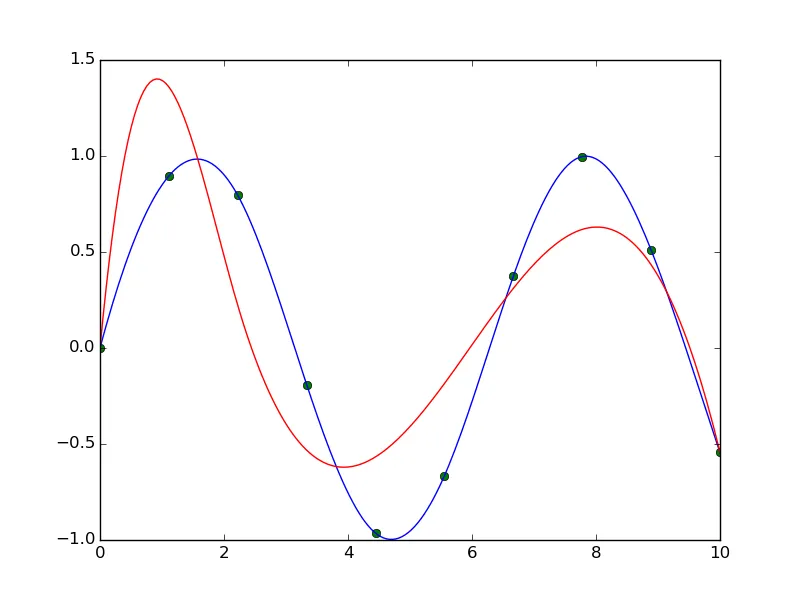
knots=x[1:-1],它就不起作用。我会感激任何帮助。简短问题:如何在样条函数中使用所有中间点作为控制节点?
注意:这张最后的图片正是我需要的,它展示了我所拥有的(通过所有点的样条线)和我需要的(带有控制节点的样条线)之间的差异。有什么想法吗?
knots = x[2:-2]都有效。底层Fortran函数的错误代码表明可能违反了Schoenberg-Whitney条件,但我无法理解它。您可以在此处找到实现方式(http://www.netlib.org/dierckx/)。这是curfit.f函数,错误代码为`ier = 10`。至少Fortran函数有很好的文档说明。 - spfrnd