我希望能够基于一组中心点和图像大小生成泰森多边形区域。
我尝试了下面的代码,基于https://rosettacode.org/wiki/Voronoi_diagram。
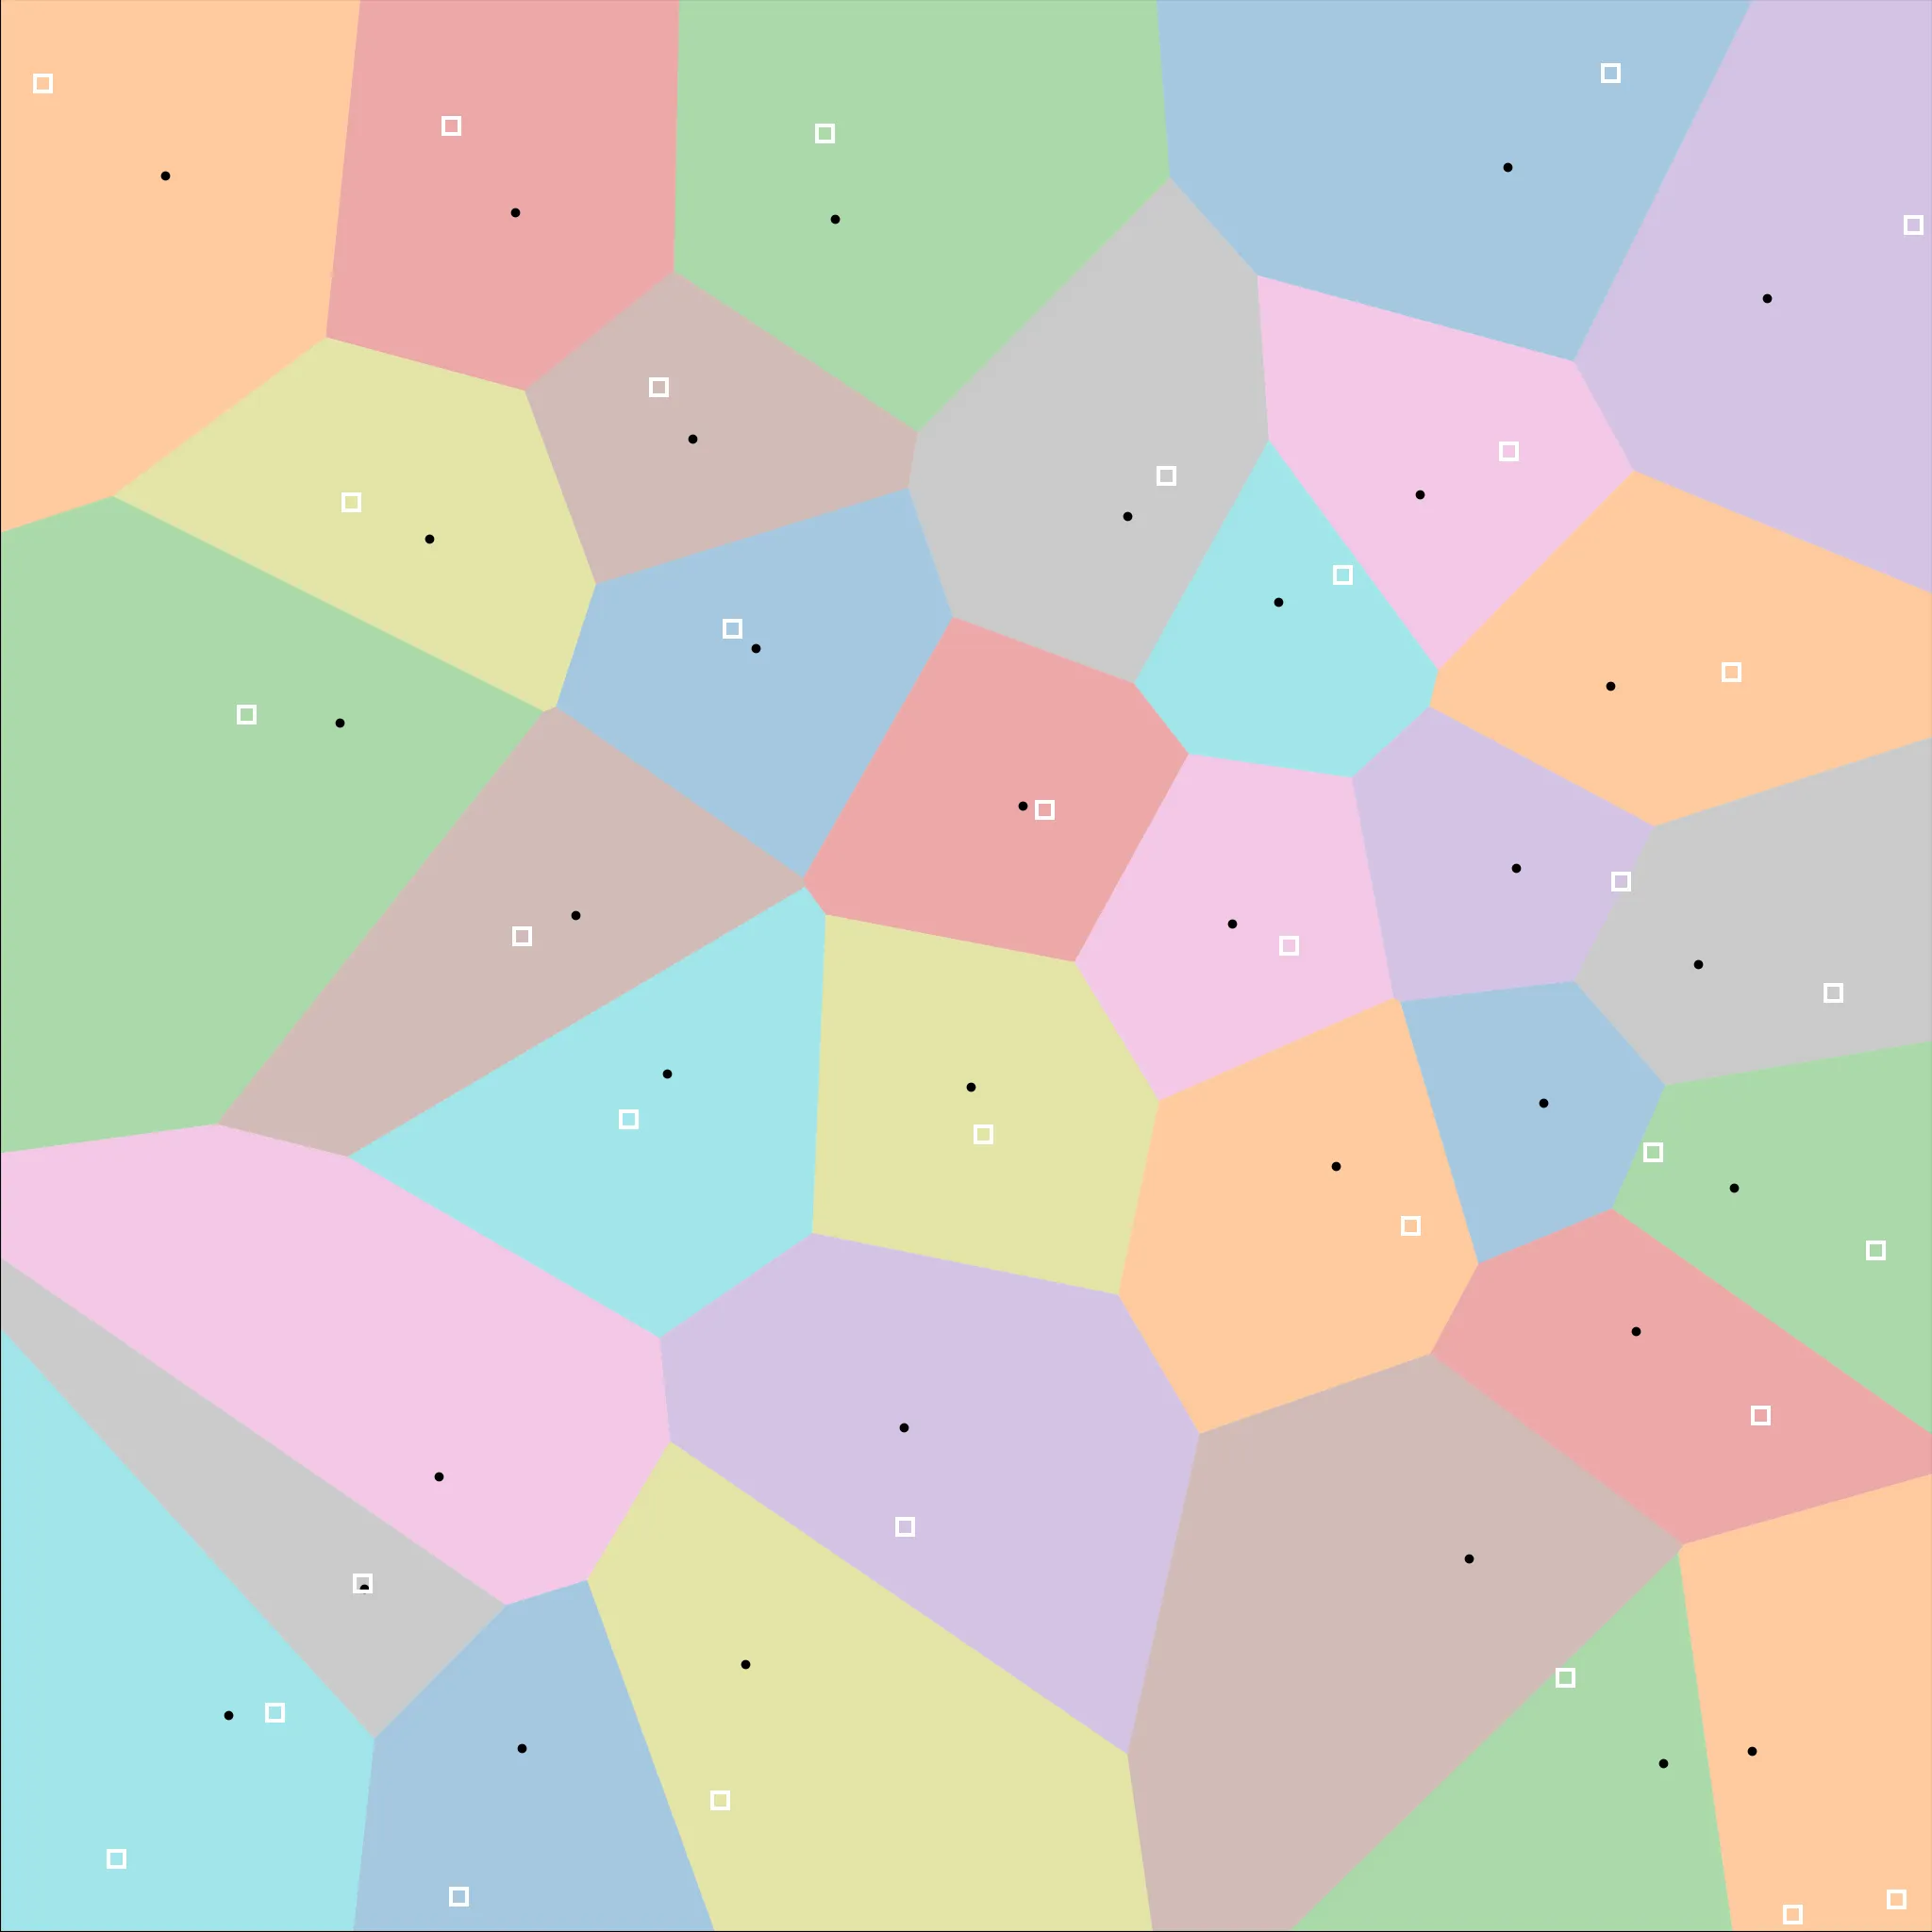
我有所需的输出:
我也尝试过https://dev59.com/HWIj5IYBdhLWcg3wMinW#20678647,它很快,但我没有找到将其转换为img_width X img_height的numpy数组的方法。主要是因为我不知道如何给scipy Voronoi class传递图像大小参数。
是否有更快的方法来获得此输出? 不需要中心或多边形边缘。
提前感谢。
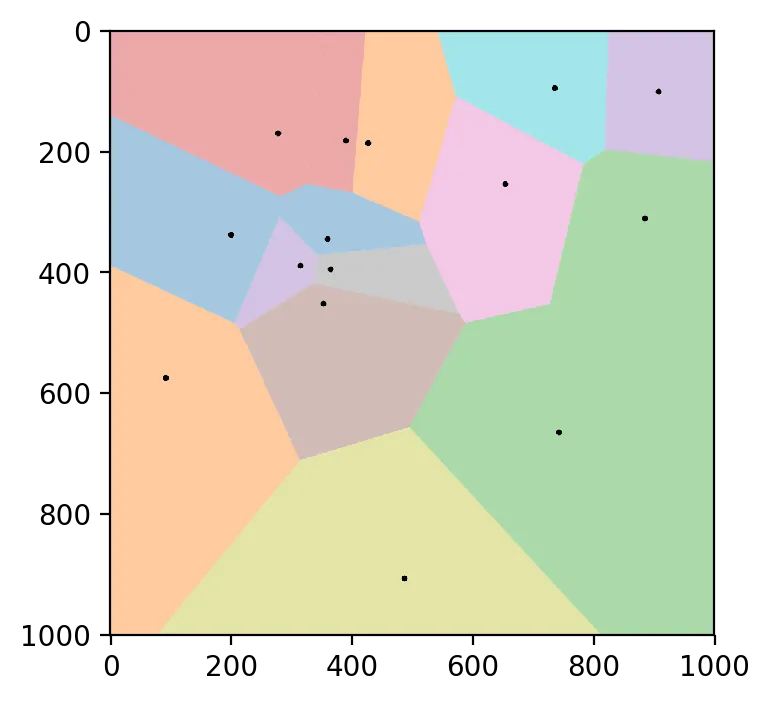
编辑2018-12-11: 使用@tel“快速解决方案”。
我尝试了下面的代码,基于https://rosettacode.org/wiki/Voronoi_diagram。
def generate_voronoi_diagram(width, height, centers_x, centers_y):
    image = Image.new("RGB", (width, height))
    putpixel = image.putpixel
    imgx, imgy = image.size
    num_cells=len(centers_x)
    nx = centers_x
    ny = centers_y
    nr,ng,nb=[],[],[]
    for i in range (num_cells):
        nr.append(randint(0, 255));ng.append(randint(0, 255));nb.append(randint(0, 255));

    for y in range(imgy):
        for x in range(imgx):
            dmin = math.hypot(imgx-1, imgy-1)
            j = -1
            for i in range(num_cells):
                d = math.hypot(nx[i]-x, ny[i]-y)
                if d < dmin:
                    dmin = d
                    j = i
            putpixel((x, y), (nr[j], ng[j], nb[j]))
    image.save("VoronoiDiagram.png", "PNG")
    image.show()
我有所需的输出:

我也尝试过https://dev59.com/HWIj5IYBdhLWcg3wMinW#20678647,它很快,但我没有找到将其转换为img_width X img_height的numpy数组的方法。主要是因为我不知道如何给scipy Voronoi class传递图像大小参数。
是否有更快的方法来获得此输出? 不需要中心或多边形边缘。
提前感谢。
编辑2018-12-11: 使用@tel“快速解决方案”。