Voronoi数据结构包含构建“无限点”的位置所需的所有信息。Qhull还将它们报告为简单的
-1索引,因此Scipy不会为您计算它们。
https://gist.github.com/pv/8036995
http://nbviewer.ipython.org/gist/pv/8037100
import numpy as np
import matplotlib.pyplot as plt
from scipy.spatial import Voronoi
def voronoi_finite_polygons_2d(vor, radius=None):
"""
Reconstruct infinite voronoi regions in a 2D diagram to finite
regions.
Parameters
----------
vor : Voronoi
Input diagram
radius : float, optional
Distance to 'points at infinity'.
Returns
-------
regions : list of tuples
Indices of vertices in each revised Voronoi regions.
vertices : list of tuples
Coordinates for revised Voronoi vertices. Same as coordinates
of input vertices, with 'points at infinity' appended to the
end.
"""
if vor.points.shape[1] != 2:
raise ValueError("Requires 2D input")
new_regions = []
new_vertices = vor.vertices.tolist()
center = vor.points.mean(axis=0)
if radius is None:
radius = vor.points.ptp().max()
all_ridges = {}
for (p1, p2), (v1, v2) in zip(vor.ridge_points, vor.ridge_vertices):
all_ridges.setdefault(p1, []).append((p2, v1, v2))
all_ridges.setdefault(p2, []).append((p1, v1, v2))
for p1, region in enumerate(vor.point_region):
vertices = vor.regions[region]
if all(v >= 0 for v in vertices):
new_regions.append(vertices)
continue
ridges = all_ridges[p1]
new_region = [v for v in vertices if v >= 0]
for p2, v1, v2 in ridges:
if v2 < 0:
v1, v2 = v2, v1
if v1 >= 0:
continue
t = vor.points[p2] - vor.points[p1]
t /= np.linalg.norm(t)
n = np.array([-t[1], t[0]])
midpoint = vor.points[[p1, p2]].mean(axis=0)
direction = np.sign(np.dot(midpoint - center, n)) * n
far_point = vor.vertices[v2] + direction * radius
new_region.append(len(new_vertices))
new_vertices.append(far_point.tolist())
vs = np.asarray([new_vertices[v] for v in new_region])
c = vs.mean(axis=0)
angles = np.arctan2(vs[:,1] - c[1], vs[:,0] - c[0])
new_region = np.array(new_region)[np.argsort(angles)]
new_regions.append(new_region.tolist())
return new_regions, np.asarray(new_vertices)
np.random.seed(1234)
points = np.random.rand(15, 2)
vor = Voronoi(points)
regions, vertices = voronoi_finite_polygons_2d(vor)
print "--"
print regions
print "--"
print vertices
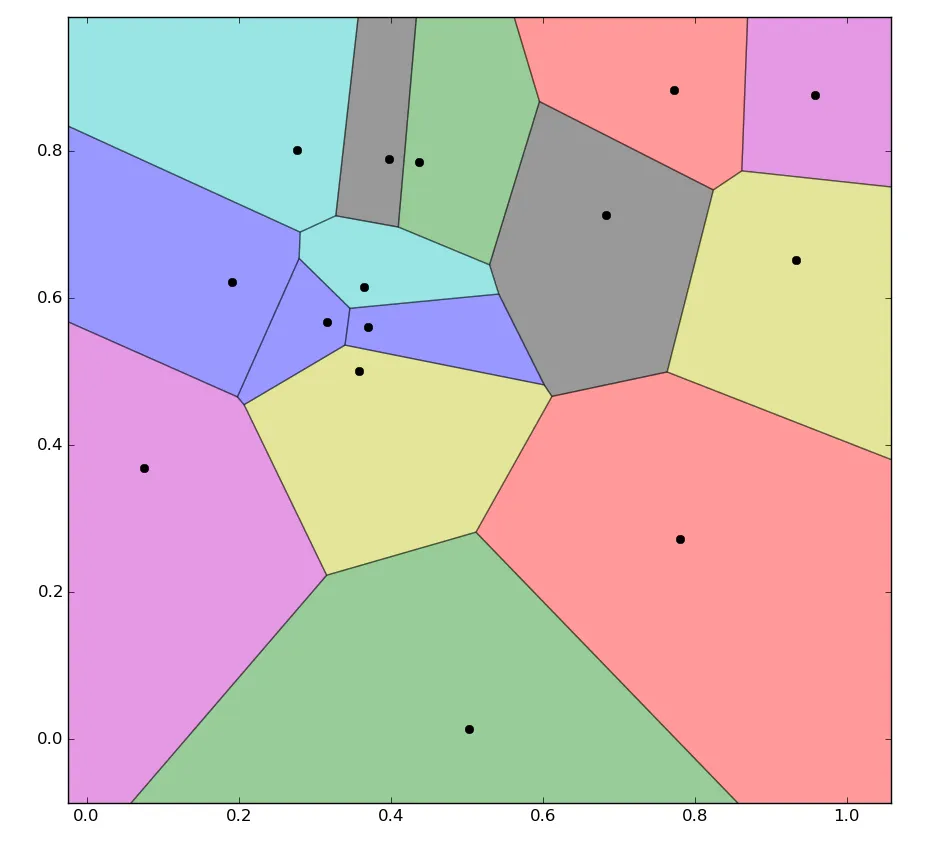
for region in regions:
polygon = vertices[region]
plt.fill(*zip(*polygon), alpha=0.4)
plt.plot(points[:,0], points[:,1], 'ko')
plt.xlim(vor.min_bound[0] - 0.1, vor.max_bound[0] + 0.1)
plt.ylim(vor.min_bound[1] - 0.1, vor.max_bound[1] + 0.1)
plt.show()
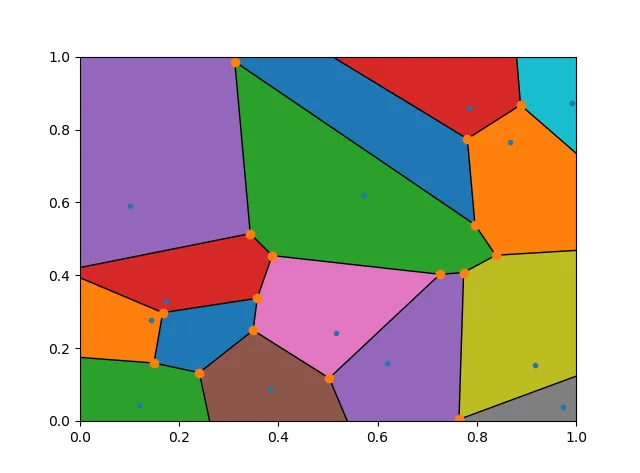
polygon = [vor.vertices[k] for k in(y for y in vor.regions [vor.point_region [i]] if y> -1)]并跳过if not -1 in region:检查。这将切掉任何延伸到无限远处的区域的角落,因此如果您不绘制单元格边界,则效果更好。 - zephyr