4个回答
6
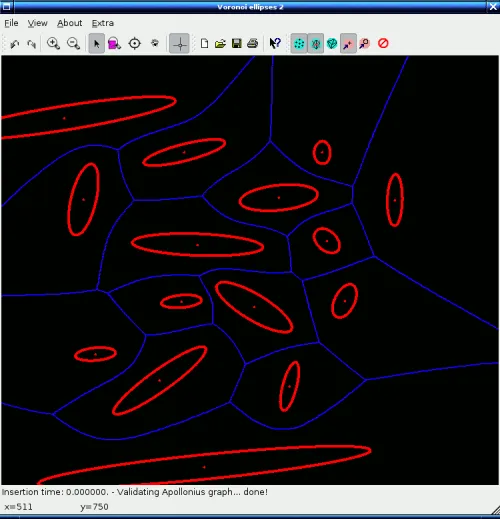
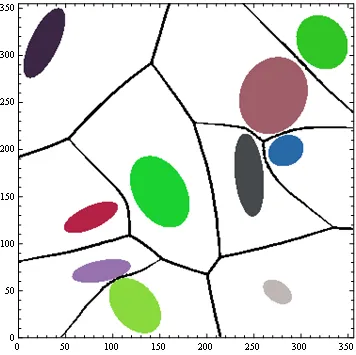
这是一种使用距离变换和分水岭算法来绘制椭圆的Voronoi图的算法。
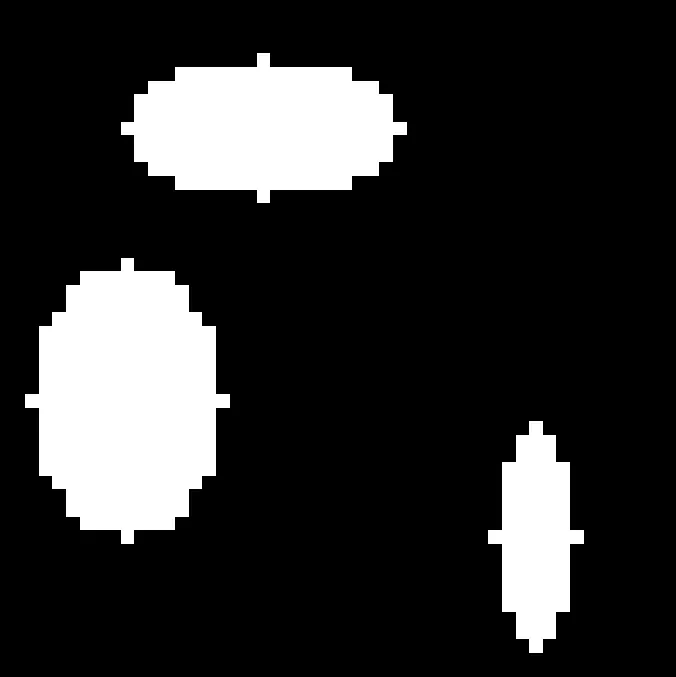
%# first, define some ellipses (for simplicity, I use 0/90 orientation)
ellipses = [10,20,5,10;30,10,10,7;40,40,8,3];

%# put the ellipses into an image (few pixels, therefore pixelated)
img = false(50);
[xx,yy]=ndgrid(1:50,1:50);
for e = 1:size(ellipses,1),img = img | (xx-ellipses(e,1)).^2/ellipses(e,3)^2 + (yy-ellipses(e,2)).^2/ellipses(e,4)^2 <= 1;end
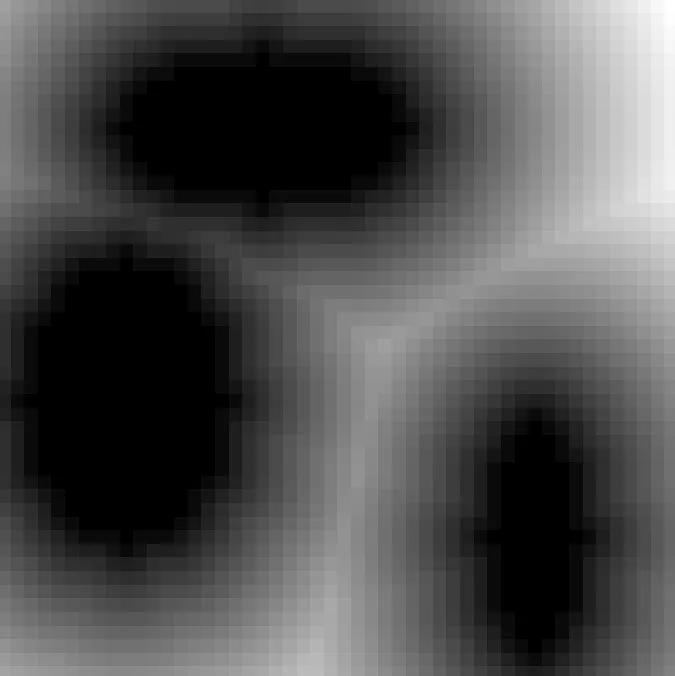
%# perform the distance transform
dt = bwdist(img);
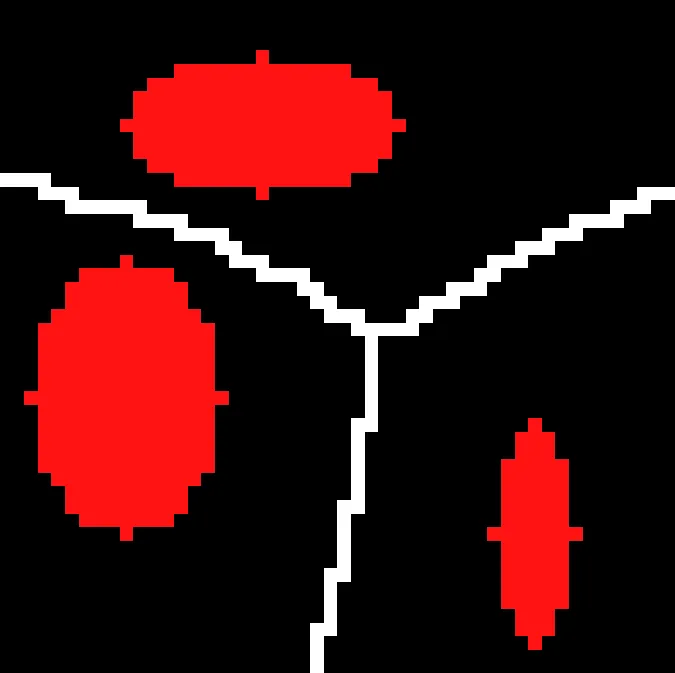
%# apply the watershed algorithm.
%# ws==0 are the lines for the Voronoi diagram
ws = watershed(dt);

%# create a RGB image and display
%# note: for yellow lines, replace the last
%# "ws==0" by "zeros(size(ws))", so that you
%# only put ws into the red and green channel (=yellow)
rgb = cat(3,ws==0,ws==0,ws==0));
%# add the ellipses into the red channel
rgb(:,:,1) = rgb(:,:,1) | img;
imshow(rgb)
- Jonas
5
2
以下是来自Mathematica帮助系统的示例:
(*Generate ellipses*)
p= Rasterize@Graphics@Table[
          Rotate[
              Disk[RandomReal[10, 2],          (*Rnd position*)
                   RandomReal[{.3, 1.5}, 2]],  (*Rnd radii*)
          RandomReal[Pi]], {i, 10}]            (*Rnd rotation*)

(*Compute Voronoi*)

LaplacianGaussianFilter[DistanceTransform[p], 2] // ImageAdjust
这不是一个精确的计算,但对于实际应用而言已经足够公正。
- Dr. belisarius
1
根据您最近的问题跟踪,我了解到您一直在处理在RGB图像上绘制光栅化椭圆。您希望能够指定椭圆的位置、形状和颜色。您希望椭圆在边界处被裁剪,并且不会重叠。现在,您想要绘制将空间分割成类似于Voronoi图(但是使用椭圆而不是点)的线条。
对于这个特定的问题,正如@Jonas所示,解决方案是使用距离变换和分水岭算法。
我想延续我的先前的例子,并结合Jonas的想法来展示整个过程。希望您觉得有用。
代码使用
对于这个特定的问题,正如@Jonas所示,解决方案是使用距离变换和分水岭算法。
我想延续我的先前的例子,并结合Jonas的想法来展示整个过程。希望您觉得有用。
代码使用
calculateEllipse函数计算组成椭圆的点的坐标,以及imoverlay函数将图像中指定像素设置为所选颜色。%# color image (canvas to draw on)
I = imread('pears.png');
sz = size(I);
%# random ellipses
num = 20;
centers = bsxfun(@times, rand(num,2), sz([2 1])); %# center x/y-coords
radii = bsxfun(@times, rand(num,2), [300 50])+10; %# major/minor axis length
angles = rand(num,1) .* 360; %# angle of rotation
ex = cell(num,1); %# vertices x-coords
ey = cell(num,1); %# vertices y-coords
%# label image, used to hold rasterized ellipses
L = zeros(sz(1),sz(2));
%# randomly place ellipses one-at-a-time, skip if overlaps previous ones
flag = false(num,1);
for i=1:num
%# ellipse we would like to draw directly on image matrix
[ex{i},ey{i}] = calculateEllipse(centers(i,1),centers(i,2), ...
radii(i,1),radii(i,2), angles(i), 100);
%# create mask for image pixels inside the ellipse polygon
mask = poly2mask(ex{i},ey{i}, sz(1),sz(2));
%# check if there is no existing overlapping ellipse
if all( L(mask)==0 )
%# use the mask to place the ellipse in the label image
L(mask) = sum(flag)+1; %# assign value using an increasing counter
flag(i) = true;
end
end
%# filter ellipses to only those that made through the overlap test
num = sum(flag);
centers = centers(flag,:);
radii = radii(flag,:);
angles = angles(flag);
ex = ex(flag);
ey = ey(flag);
%# rasterized voroni diagram of the ellipses [Jonas]
E = (L ~= 0); %# ellipses as binary image
WS = watershed( bwdist(E) ); %# distance transform + watershed
WS = (WS == 0); %# WS==0 corresponds voronoi diagram
WS = bwmorph(WS, 'thicken',1); %# thicken the lines
%# set pixels corresponding to voronoi diagram to white
II = I;
II = imoverlay(II, WS, [1 1 1]); %# you can customize the color here
%# set pixels corresponding to ellipses using specified colors
clr = hsv(num); %# color of each ellipse
for i=1:num
mask = bwperim(L==i,8); %# get perimeter of the ellipse mask
mask = bwmorph(mask, 'thicken',1); %# thicken the ellipse perimeter
II = imoverlay(II, mask, clr(i,:)); %# set those pixels with RGB color
end
%# show final rasterized image (image + ellipses + voronoi diagram)
figure, imshow(II, 'InitialMagnification',100, 'Border','tight')
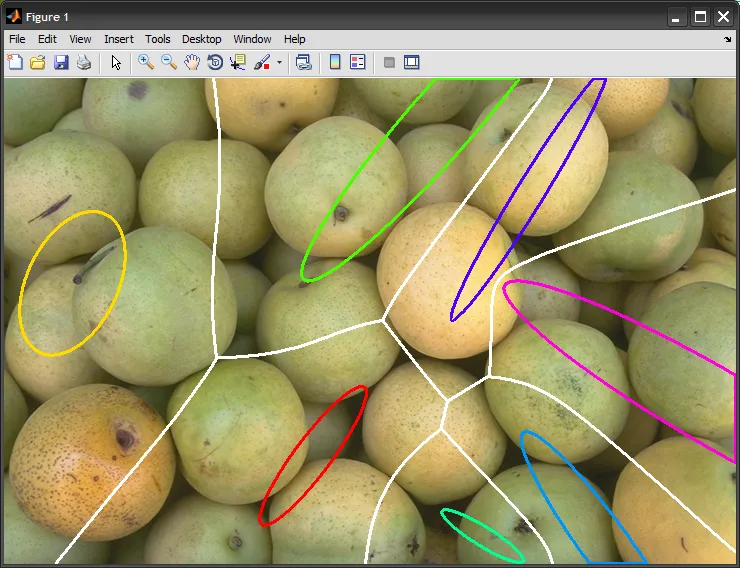
- Amro
9
我试图绘制实心椭圆,所以我删除了获取椭圆周长的代码行'mask = bwperim(L==i,8);',但输出结果只有一个实心椭圆。这是为什么?这是某种逻辑错误吗? - Elsie
@Ivy:如果你想画实心椭圆,你还应该删除它后面的线条(加粗边缘),这样你只需要:
mask = (L==i); - Amro@Ivy:基本上在之前的步骤中,我们构建了一个包含逻辑矩阵(真/假)的“掩码”,该矩阵指示椭圆内部。现在,在将其放置在标签矩阵中之前,我们检查它是否与任何现有的椭圆重叠,这是通过检查掩码指示的所有“真”像素在标签矩阵中是否都具有零值来完成的(如果至少有一个像素为非零,则意味着我们已经放置了一个通过该位置的椭圆,因此我们跳过当前的椭圆)。 - Amro
谢谢。如果椭圆仅仅是“接触”,我该如何检查并跳过后面的那个呢?因为当我将“num”增加到约50时,而我将所有半径设置为相同的值[10 6],在几次尝试中会发生接触。在bwdist和watershed之后,这两个接触的椭圆将被视为一个,并因此被包含在一个单元格中(一个单元格中有两个椭圆)。这不是我期望的结果。 - Elsie
显示剩余4条评论
0
我不知道你在这里所说的“省略号”是什么意思。但是,Stephan Fortune / Shane O'Sullivan已经在C++中实现了Voronoi图的算法。
- RED SOFT ADAIR
1
省略号代替了由线条所限定的“点”(x,y)。 - Elsie
网页内容由stack overflow 提供, 点击上面的可以查看英文原文,
原文链接
原文链接
rgb = repmat(ws==0,1,1,3);rgb(:,:,1) = rgb(:,:,1) | img;imshow(rgb)- Jonasrgb=repmat(ws==0,[1 1 3]);。 - Jonas