在MATLAB中绘制椭圆和椭球

14

如何使用MATLAB绘制椭圆和椭球?

(x^2/a^2)+(y^2/b^2)=1

n=40;
a=0;   b=2*pi;
c=0;   d=2*pi;
for i=1:n
    u=a+(b-a)*(i-1)/(n-1);
    for j=1:m
        v=a+(d-c)*(j-1)/(m-1);
        x(i,j)=sin(u)*cos(v);
        y(i,j)=sin(u)*sin(v);
        z(i,j)=cos(u);
    end
end
mesh(x,y,z);

但是我想要形状?

6个回答

41

维基百科上,椭圆文章有一个简单的JavaScript代码来绘制椭圆。

它使用参数方程式:

x(theta) = a0 + ax*sin(theta) + bx*cos(theta)
y(theta) = b0 + ay*sin(theta) + by*cos(theta)

在哪里

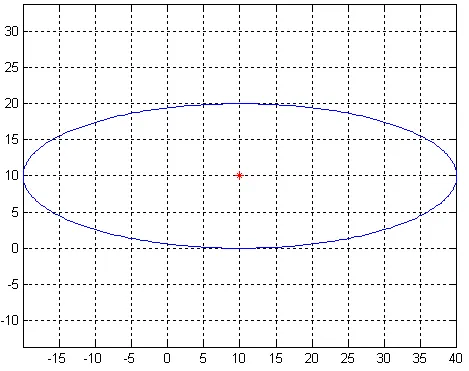
(a0,b0) is the center of the ellipse
(ax,ay) vector representing the major axis
(bx,by) vector representing the minor axis

我将代码翻译成了MATLAB函数:

calculateEllipse.m

function [X,Y] = calculateEllipse(x, y, a, b, angle, steps)
    %# This functions returns points to draw an ellipse
    %#
    %#  @param x     X coordinate
    %#  @param y     Y coordinate
    %#  @param a     Semimajor axis
    %#  @param b     Semiminor axis
    %#  @param angle Angle of the ellipse (in degrees)
    %#

    narginchk(5, 6);
    if nargin<6, steps = 36; end

    beta = -angle * (pi / 180);
    sinbeta = sin(beta);
    cosbeta = cos(beta);

    alpha = linspace(0, 360, steps)' .* (pi / 180);
    sinalpha = sin(alpha);
    cosalpha = cos(alpha);

    X = x + (a * cosalpha * cosbeta - b * sinalpha * sinbeta);
    Y = y + (a * cosalpha * sinbeta + b * sinalpha * cosbeta);

    if nargout==1, X = [X Y]; end
end

并附有一个测试示例:

%# ellipse centered at (0,0) with axes length
%# major=20, ,minor=10, rotated 50 degrees
%# (drawn using the default N=36 points)
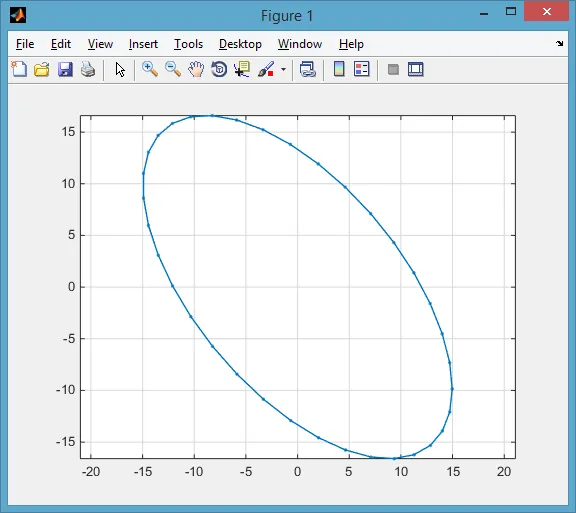
p = calculateEllipse(0, 0, 20, 10, 50);
plot(p(:,1), p(:,2), '.-'), axis equal

example rotated ellipse


12
我已经为您的需要调整了这个来自MATLAB Central的优秀的椭圆绘制脚本equation_ellipse
function plotEllipse(a,b,C)

    % range to plot over
    %------------------------------------
    N = 50;
    theta = 0:1/N:2*pi+1/N;

    % Parametric equation of the ellipse
    %----------------------------------------
    state(1,:) = a*cos(theta); 
    state(2,:) = b*sin(theta);

    % Coordinate transform (since your ellipse is axis aligned)
    %----------------------------------------
    X = state;
    X(1,:) = X(1,:) + C(1);
    X(2,:) = X(2,:) + C(2);

    % Plot
    %----------------------------------------
    plot(X(1,:),X(2,:));
    hold on;
    plot(C(1),C(2),'r*');
    axis equal;
    grid;

end

注意:将N更改为定义您的椭圆分辨率

这是一个以(10,10)为中心,a=30b=10的椭圆

Ellipse


12

来自JacobAmro的答案提供了计算和绘制椭圆点的很好的例子。我会介绍一些简单的方法,让您可以绘制一个椭球体...

首先,MATLAB有一个内置函数ELLIPSOID,根据椭球体的中心和半轴长度生成一组网格点。下面创建了矩阵xyz,用于表示以原点为中心,分别在x、y、z方向上具有半轴长度4、2和1的椭球体:

[x, y, z] = ellipsoid(0, 0, 0, 4, 2, 1);
您可以使用函数MESH绘制它,返回绘制表面对象的句柄。
hMesh = mesh(x, y, z);

如果你想旋转绘制的椭球体,你可以使用ROTATE函数。以下是围绕y轴旋转45度的应用:

rotate(hMesh, [0 1 0], 45);

你可以调整绘图的外观,得到以下的图形:

axis equal;      %# Make tick mark increments on all axes equal
view([-36 18]);  %# Change the camera viewpoint
xlabel('x');
ylabel('y');
zlabel('z');

在此输入图片描述

另外,如果您希望对旋转的绘图点进行进一步的计算,可以从绘制的表面对象中获取它们:

xNew = get(hMesh, 'XData');  %# Get the rotated x points
yNew = get(hMesh, 'YData');  %# Get the rotated y points
zNew = get(hMesh, 'ZData');  %# Get the rotated z points

4

椭圆在维基百科和旋转矩阵的文章。

重写以下函数:

  • (0,0)为中心,逆时针旋转rotAngle

  • 坐标变换到(cx, cy)


function [X,Y] = calculateEllipse(cx, cy, a, b, rotAngle)
    %# This functions returns points to draw an ellipse
    %#
    %#  @param x     X coordinate
    %#  @param y     Y coordinate
    %#  @param a     Semimajor axis
    %#  @param b     Semiminor axis
    %#  @param cx    cetner x position
    %#  @param cy    cetner y position
    %#  @param angle Angle of the ellipse (in degrees)
    %#

    steps = 30;
    angle = linspace(0, 2*pi, steps);

    % Parametric equation of the ellipse
    X = a * cos(angle);
    Y = b * sin(angle);

    % rotate by rotAngle counter clockwise around (0,0)
    xRot = X*cosd(rotAngle) - Y*sind(rotAngle);
    yRot = X*sind(rotAngle) + Y*cosd(rotAngle);
    X = xRot;
    Y = yRot;

    % Coordinate transform
    X = X + cx;
    Y = Y + cy;
end

并提供一个测试示例:

例如:

[X,Y] = calculateEllipse(0, 0, 20, 10, 0);
plot(X, Y, 'b'); hold on; % blue
[X,Y] = calculateEllipse(0, 0, 20, 10, 45);
plot(X, Y, 'r'); hold on; % red
[X,Y] = calculateEllipse(30, 30, 20, 10, 135);
plot(X, Y, 'g'); % green
grid on;

Figure 1


2
创建两个向量,一个是椭球周围点的x坐标,另一个是y坐标。使这些向量足够长以满足您的精度要求。将这两个向量作为(x,y)对连接起来绘制出来。建议在代码中删除for循环,使用向量符号更加清晰明了。此外,我建议使用SO标记格式化您的问题,以使其更加清晰易懂。

ooi:Mark的建议不仅使您的代码更易读,而且使其更加高效。 - Martijn

-2
最简单的方法可能是使用Matlab函数。
pdeellip(xc,yc,a,b,phi) 

例如:
pdeellip(0,0,1,0.3,pi/4) 

然而,这个简单的解决方案可以让你快速地看到椭圆的外观。如果你想要一个漂亮的图形,可以看看其他的解决方案。

我不知道在哪个版本的Matlab中添加了这个功能,但至少从R2012b版本开始就有了。


2
pdeellip函数是“偏微分方程工具箱”的一部分,它将在PDE应用程序中绘制一个椭圆,不适用于常规图形/轴。 - Amro
正确,但那不是ooi所问的。问题只是如何绘制椭圆。如果你只想快速地看一下椭圆的样子,这可能是最快的方法。 - nightlyop
1
好的,没问题(顺便说一下,我没有给你点踩),我只是在指出这个函数的上下文。 - Amro
你说得对。我本可以在答案中提到它(所以我已经编辑了答案)。 - nightlyop

网页内容由stack overflow 提供, 点击上面的
可以查看英文原文,
原文链接