如何将轴坐标转换为像素坐标? 我有一组包含负数和浮点值的数据,我需要将所有数据放入图像中。但像素坐标都是正整数。怎么解决负数问题?
轴坐标转像素坐标?(Matlab)
3
- Elsie
3
你需要生成什么类型的图表?散点图、折线图等等。此外,你的数据是什么形式?X和Y向量,Nx2矩阵等等。 - reve_etrange
数据集[X,Y]是可以组成椭圆的点坐标。我可以绘制出椭圆,但现在我面临的困难是将所有坐标放入图像(像素坐标)中。我应该在图像中绘制椭圆。 - Elsie
@Ivy:我根据你的评论发布了一个答案。 - Amro
2个回答
4
据我所知,您有一组表示椭圆的点,并希望直接在图像矩阵中绘制它们(而不仅仅是在屏幕上显示)。
为此,您可以使用POLY2MASK函数将椭圆转换为二进制掩码。然后通过计算其周长, 这将给我们一个仅表示构成椭圆的像素的二进制掩码,该掩码被应用于图像以设置像素的颜色。
请考虑以下示例。我正在使用先前在SO上提出的calculateEllipse.m函数:
为此,您可以使用POLY2MASK函数将椭圆转换为二进制掩码。然后通过计算其周长, 这将给我们一个仅表示构成椭圆的像素的二进制掩码,该掩码被应用于图像以设置像素的颜色。
请考虑以下示例。我正在使用先前在SO上提出的calculateEllipse.m函数:
%# some image
I = imread('pout.tif');
sz = size(I);
%# ellipse we would like to draw directly on image matrix
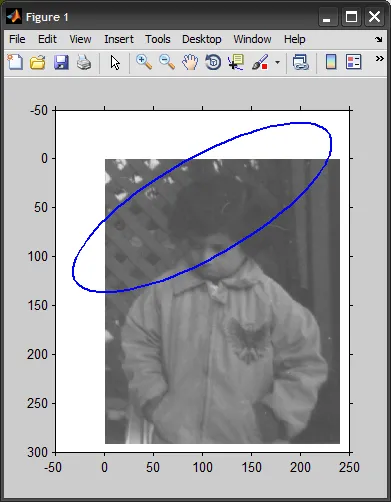
[x,y] = calculateEllipse(100,50, 150,50, 30, 100);
%# lets show the image, and plot the ellipse (overlayed).
%# note how ellipse have floating point coordinates,
%# and also have points outside the image boundary
figure, imshow(I)
hold on, plot(x,y, 'LineWidth',2)
axis([-50 250 -50 300]), axis on
%# create mask for image pixels inside the ellipse polygon
BW = poly2mask(x,y,sz(1),sz(2));
%# get the perimter of this mask
BW = bwperim(BW,8);
%# use the mask to index into image
II = I;
II(BW) = 255;
figure, imshow(II)
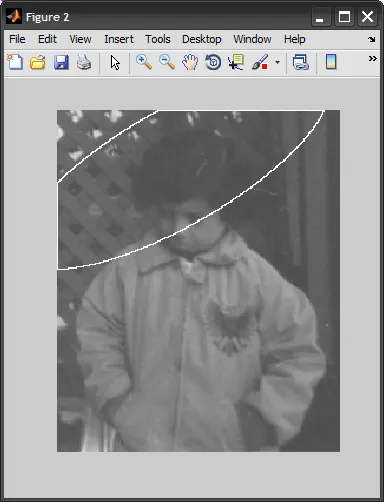
x 和 y 坐标要更好(它还可以处理超出边界的点)。确保阅读 POLY2MASK 的算法部分,了解其在亚像素级别上的工作原理。
编辑:
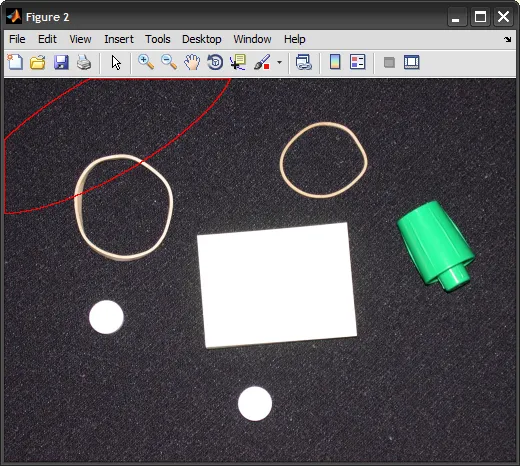
如果您正在处理RGB图像(三维矩阵),同样适用,您只需要更改最后一部分,即我们使用二进制掩模的部分:
%# color of the ellipse (red)
clr = [255 0 0];                %# assuming UINT8 image data type

%# use the mask to index into image
II = I;
z = false(size(BW));
II( cat(3,BW,z,z) ) = clr(1);   %# R channel
II( cat(3,z,BW,z) ) = clr(2);   %# G channel
II( cat(3,z,z,BW) ) = clr(3);   %# B channel
figure, imshow(II)
这是另一种方法:
%# use the mask to index into image
II = I;
BW_ind = bsxfun(@plus, find(BW), prod(sz(1:2)).*(0:2));
II(BW_ind) = repmat(clr, [size(BW_ind,1) 1]);
figure, imshow(II)
- Amro
2
我该如何修改上述的“BW”以控制蒙版周边的颜色,我打算使用RGB值。 - Elsie
@Ivy:这只是一个索引的问题,看一下我上面的编辑(一个使用逻辑索引,另一个使用线性索引)。 - Amro
3
您可以将坐标向量传递给
如果您需要图像矩阵,请使用以下代码:
您也可以使用
此外,还有这个来自文件交换所的m文件集,它们已经非常接近您需要的内容了。
最后,以下是一种简单的方法,可以在指定的精度范围内获得您想要的结果:
scatter函数。x = [-1.2 -2.4 0.3 7];
y = [2 -1 1 -3];
scatter(x,y,'.');
如果您需要图像矩阵,请使用以下代码:
h = figure();
scatter(x,y);
F = getframe(h);
img = F.cdata;
您也可以使用
print将图形保存到文件中(或者直接从图形窗口导出),然后使用imread读取该文件。此外,还有这个来自文件交换所的m文件集,它们已经非常接近您需要的内容了。
最后,以下是一种简单的方法,可以在指定的精度范围内获得您想要的结果:
precision = 10;        %# multiple of 10
mi = min(min(x),min(y));
x = x - mi;        %# subtract minimum to get rid of negative numbers
y = y - mi;
x = round(x*precision) + 1;    %# "move" decimal point, round to integer,
y = round(y*precision) + 1;    %# add 1 to index from 1
img = zeros(max(max(x),max(y)));    %# image will be square, doesn't have to be
x = uint32(x);
y = uint32(y);
ind = sub2ind(size(img),y,x);    %# use x,y or reverse arrays to flip image
img(ind) = 1;    %# could set intensity or RGB values in a loop instead
"精度"参数决定了浮点数值保留的小数位数,从而影响图像的分辨率和精确度。将数据转换为uint32可能是不必要的。
如果您有一个Nx3矩阵,其中包含每个N个点的RGB值:
img = zeros(max(max(x),max(y)),max(max(x),max(y)),3);
for i=1:length(N)        %# N = length(x) = length(y)
    img(x(i),y(i),:) = rgb(i,:);
end
- reve_etrange
4
非常感谢。我觉得你的资源对我会很有帮助。 - Elsie
我已经使用上述代码测试了我的椭圆。但是我不理解 'round(x*precision) + 1' 这段代码的含义。这段代码是做什么用的?'+1' 是什么意思?它是某种转换吗? - Elsie
在减去最小值后,新的最小值为零。一旦我们准备将
x和y用作索引,我们需要加1,因为MATLAB从1开始索引。 - reve_etrange我已经对代码块进行了注释,希望现在更加清晰明了。如果需要的话,请查找并替换井号字符。 - reve_etrange
网页内容由stack overflow 提供, 点击上面的可以查看英文原文,
原文链接
原文链接