如果我通过
获取坐标信息coords = get(0,'PointerLocation');
我该如何将它们转换为通过ginput获取的点?
也就是说,我想从中获得相同的值。
coords = get(0,'PointerLocation');
coords=someConversion(coords);
我可以通过调用来获取
coords=ginput(1);
在与上一段代码中鼠标相同的位置单击图形。
如果我通过
获取坐标信息coords = get(0,'PointerLocation');
我该如何将它们转换为通过ginput获取的点?
也就是说,我想从中获得相同的值。
coords = get(0,'PointerLocation');
coords=someConversion(coords);
我可以通过调用来获取
coords=ginput(1);
在与上一段代码中鼠标相同的位置单击图形。
hAxes的轴对象。使用函数ginput将允许您在轴内选择点。要从get(0,'PointerLocation')获取等效的一组点(它给出与屏幕相关的坐标),您必须考虑到图形位置、轴位置、轴宽度/高度和轴限制。'Units'属性设置为'pixels',获取位置,然后将'Units'属性设置回先前的属性。我通常会创建自己的函数get_in_units来完成此部分:function value = get_in_units(hObject, propName, unitType)
oldUnits = get(hObject, 'Units'); % Get the current units for hObject
set(hObject, 'Units', unitType); % Set the units to unitType
value = get(hObject, propName); % Get the propName property of hObject
set(hObject, 'Units', oldUnits); % Restore the previous units
end
get_coords,该函数获取屏幕坐标并将其转换为轴坐标:function coords = get_coords(hAxes)
% Get the screen coordinates:
coords = get_in_units(0, 'PointerLocation', 'pixels');
% Get the figure position, axes position, and axes limits:
hFigure = get(hAxes, 'Parent');
figurePos = get_in_units(hFigure, 'Position', 'pixels');
axesPos = get_in_units(hAxes, 'Position', 'pixels');
axesLimits = [get(hAxes, 'XLim').' get(hAxes, 'YLim').'];
% Compute an offset and scaling for coords:
offset = figurePos(1:2)+axesPos(1:2);
axesScale = diff(axesLimits)./axesPos(3:4);
% Apply the offsets and scaling:
coords = (coords-offset).*axesScale+axesLimits(1, :);
end
生成的coords应该接近使用ginput得到的结果。请注意,如果axes对象嵌套在图形中的任何uipanel对象中,则还必须考虑面板位置。
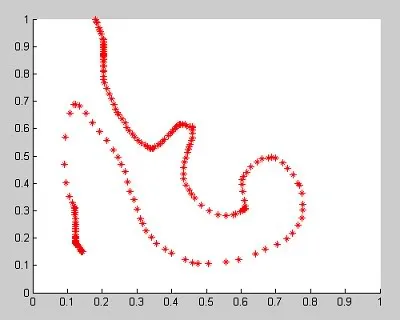
为了说明上述代码的行为,这里有一个简洁的示例。创建上述函数后,请创建第三个函数:
function axes_coord_motion_fcn(src, event, hAxes)

  coords = get_coords(hAxes);               % Get the axes coordinates
  plot(hAxes, coords(1), coords(2), 'r*');  % Plot a red asterisk

end
然后运行以下代码:
hFigure = figure;  % Create a figure window
hAxes = axes;      % Create an axes in that figure
axis([0 1 0 1]);   % Fix the axes limits to span from 0 to 1 for x and y
hold on;           % Add new plots to the existing axes
set(hFigure, 'WindowButtonMotionFcn', ...  % Set the WindowButtonMotionFcn so
    {@axes_coord_motion_fcn, hAxes});      %   that the given function is called
                                           %   for every mouse movement
您可以使用getpixelposition(gcf)获取图形的位置,然后从PointerLocation中减去前两个元素(左下角的x、y)以获取相对图形位置。
对于更复杂的转换(例如相对于某些内部面板或轴),您可能需要递归地获取子组件的相对位置。查看pixelposition.m或moveptr.m以获取一些示例。