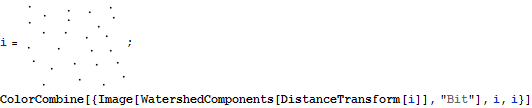
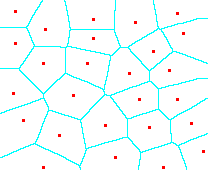
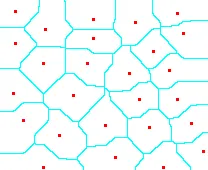
我在使用Mathematica(版本8)时遇到了一个大问题。 绘制Voronoi图很简单,但是如何更改范数呢?
<< DiscreteMath`ComputationalGeometry`
data2D = {{4.4, 14}, {6.7, 15.25}, {6.9, 12.8}, {2.1, 11.1}, {9.5,
14.9}, {13.2, 11.9}, {10.3, 12.3}, {6.8, 9.5}, {3.3, 7.7}, {0.6,
5.1}, {5.3, 2.4}, {8.45, 4.7}, {11.5, 9.6}, {13.8, 7.3}, {12.9,
3.1}, {11, 1.1}};
DiagramPlot[data2D, LabelPoints -> False]
给我关于L_2范数(欧几里得范数)的Voronoi图。 我还需要关于L_1范数和L_infinity范数的图。
Norm。如果使用Norm,您可以通过将代码包装在Block[{Norm = <new norm>}, ...]中来覆盖它。 - rcollyerDiagramPlot及其组成部分使用了Norm,那么您可以使用Block来覆盖该行为,因为它允许您创建现有符号的局部定义。然而,在内部,它们使用形式Sqrt[ (a1-b1)^2 + (a2 - b2)^2 + (a3 - b3)^2]而不是Norm,因此您不能简单地覆盖该行为。相反,您将不得不重新实现代码以接受不同的标准,因此出现了术语:“roll your own。” - rcollyer