我想在我的聚类中添加一个沃罗诺伊图。也就是说,我想要一个包含我的聚类、质心和沃罗诺伊区域的绘图。有没有简单的方法可以实现?
我尝试过:
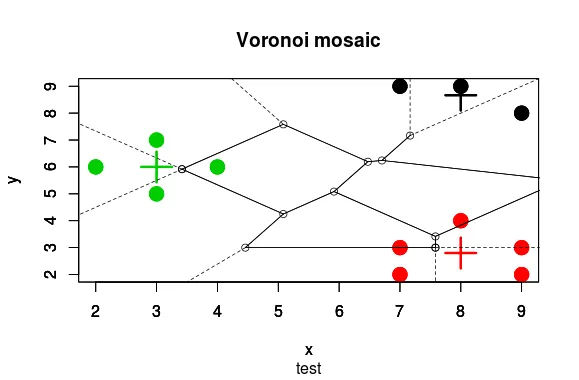
                    x<-c(4,7,9,2,3,3,7,7,8,8,9,9)
                    y<-c(6,3,3,6,5,7,2,9,4,9,2,8)

                    mat<-cbind(x,y)# defining matrix
                    Kmeans<-kmeans(mat,centers=3) # with 3 centroids
                    plot(x,y,col=Kmeans$cluster,pch=19,cex=2)
                    points(Kmeans$centers,col=1:3,pch=3,cex=3,lwd=3)

                    library(tripack)
                    test<-voronoi.mosaic(x,y)
                    plot(x,y,col=Kmeans$cluster,pch=19,cex=2)
                    plot(test)
我不知道如何将它们组合起来以产生合理的图表。