如何使用pandas绘制垂直面积图

6

有没有一种简单的方法使用pandas绘制面积图,但将图表垂直排列?

例如,要水平绘制面积图,可以这样做:

import pandas as pd
import numpy as np

df = pd.DataFrame(np.random.rand(10, 4), columns=['a', 'b', 'c', 'd'])
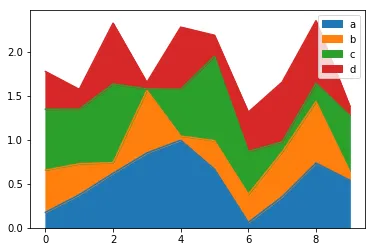
df.plot(kind='area');
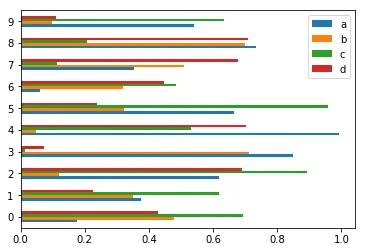
enter image description here

我可以使用'barh'垂直绘制条形图

df.plot(kind='barh');

enter image description here

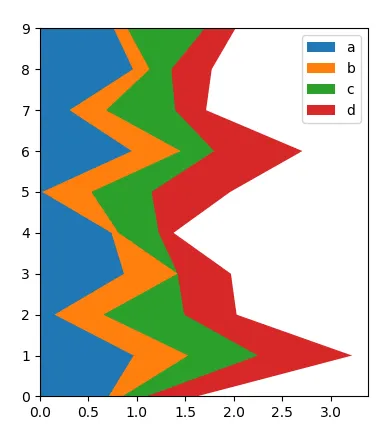
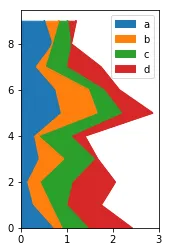
但我无法想出一种简单直接的方法来使区域图垂直显示


最不专业的选项,但找到一种方法让matplotlib将您的图形旋转90度。 - cs95
2个回答

6
熊猫库没有提供垂直堆叠图的原因是因为Matplotlib中的stackplot仅适用于水平堆叠。然而,堆叠图最终只是填充线图。因此,您可以使用fill_betweenx()函数绘制数据以获得所需的图形。
import pandas as pd
import numpy as np; np.random.rand(42)
import matplotlib.pyplot as plt

df = pd.DataFrame(np.random.rand(10, 4), columns=['a', 'b', 'c', 'd'])

fig, ax = plt.subplots()

data = np.cumsum(df.values, axis=1)
for i, col in enumerate(df.columns):
    ax.fill_betweenx(df.index, data[:,i], label=col, zorder=-i)
ax.margins(y=0)
ax.set_xlim(0, None)
ax.set_axisbelow(False)

ax.legend()


plt.show()

enter image description here


1

应该有更好的解决方案

绘图 - 旋转90度 - 垂直反射

import matplotlib.pyplot as plt
from matplotlib import pyplot, transforms

df = pd.DataFrame(np.random.rand(10, 4), columns=['a', 'b', 'c', 'd'])
base = plt.gca().transData
rot = transforms.Affine2D().rotate_deg(90)
reflect_vertical = transforms.Affine2D(np.array([[1, 0, 0], [0, -1, 0], [0, 0, 1]]))
df.plot(kind='area', transform= reflect_vertical + rot + base, ax=plt.gca(), xlim=(0, 3))
plt.gca().set_aspect(0.5)

enter image description here


谢谢,这正是我所思考的方向,不过我很惊讶这是必要的。 - johnchase

网页内容由stack overflow 提供, 点击上面的
可以查看英文原文,
原文链接