我目前已成功绘制出了饼图,并使用相对较小的数据帧。
 但是,当我尝试绘制pandas饼图时,它看起来非常好,直到我意识到我的索引已被包括在内(请参见右上角和左下角的数字0和1)。
但是,当我尝试绘制pandas饼图时,它看起来非常好,直到我意识到我的索引已被包括在内(请参见右上角和左下角的数字0和1)。
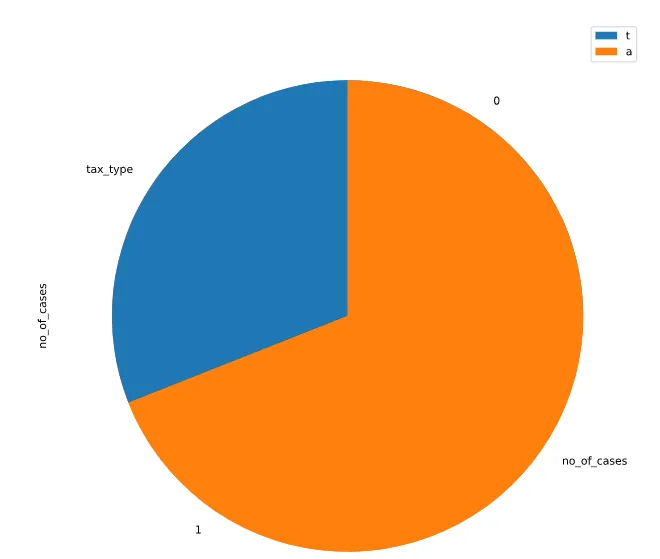
有没有办法删除索引?目前,我非常怀疑问题出在重置和删除旧索引的部分。
这是我的代码:
import pandas as pd
import matplotlib.pyplot as plt
import numpy as np
# import the csv file
dataname = 'Datasets\\tax-and-penalty-arising-from-audits-by-tax-type.csv'
data = pd.read_csv(dataname)
df = pd.DataFrame(data)
# drop the no_of_cases column since we will not be using it
df2 = df.drop(['tax_and_penalty_arising'],axis=1)
# merge the values: individual income tax and corporate income tax together under tax type together as they can be seen to be seperated in some years eg 2011
dictionary = {'Corporate Income Tax':'Individual and Corporate Income Tax','Individual Income Tax':'Individual and Corporate Income Tax'}
df3 = df2.groupby(['financial_year',df2['tax_type'].replace(dictionary)]).sum().reset_index()
# get only the data from the latest financial_year(2018)
df4 = df3[(df3.financial_year == (2018))]
df4 = df4.reset_index(drop=True)
# # drop the column financial_year as we will not be using it
df4 = df4.drop(['financial_year'],axis=1)
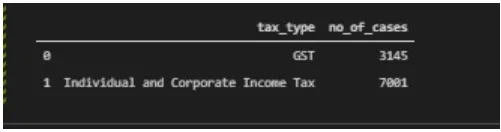
# # print the dataframe
print(df4)
# plot out the pie chart
# df4 = df4.drop("index",axis=1)
ax = df4.plot.pie(y='no_of_cases',figsize=(10,10))
ax.legend(labels='tax_type')
plt.pie(df4['no_of_cases'],labels=df4['tax_type'],shadow=False,startangle=90, autopct="%1.1f%%")
plt.show()
