我找到了绘制散点饼图的代码示例。
在这个示例中,所有三个散点图中每个饼图切片的大小都是相同的。我想知道是否可以使每个饼图都是独特的(不同数量的切片和不同的饼图比例)。
没问题,完全可以实现。下面是一个函数,用于在给定位置和给定大小绘制饼图:
def draw_pie(dist,
             xpos,
             ypos,
             size,
             ax=None):
    if ax is None:
        fig, ax = plt.subplots(figsize=(10,8))

    # for incremental pie slices
    cumsum = np.cumsum(dist)
    cumsum = cumsum/ cumsum[-1]
    pie = [0] + cumsum.tolist()

    for r1, r2 in zip(pie[:-1], pie[1:]):
        angles = np.linspace(2 * np.pi * r1, 2 * np.pi * r2)
        x = [0] + np.cos(angles).tolist()
        y = [0] + np.sin(angles).tolist()

        xy = np.column_stack([x, y])

        ax.scatter([xpos], [ypos], marker=xy, s=size)

    return ax
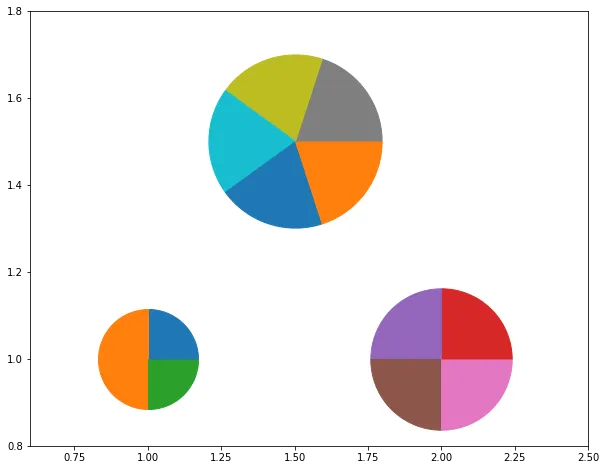
fig, ax = plt.subplots(figsize=(10,8))
draw_pie([1,2,1],1,1,10000,ax=ax)
draw_pie([2,2,2,2], 2, 1, 20000, ax=ax)
draw_pie([1,1,1,1,1], 1.5,1.5, 30000, ax=ax)
plt.xlim(0.6,2.5)
plt.ylim(0.8, 1.8)
plt.show()
给出:
你可以这样实现:
import numpy as np
import matplotlib.pyplot as plt
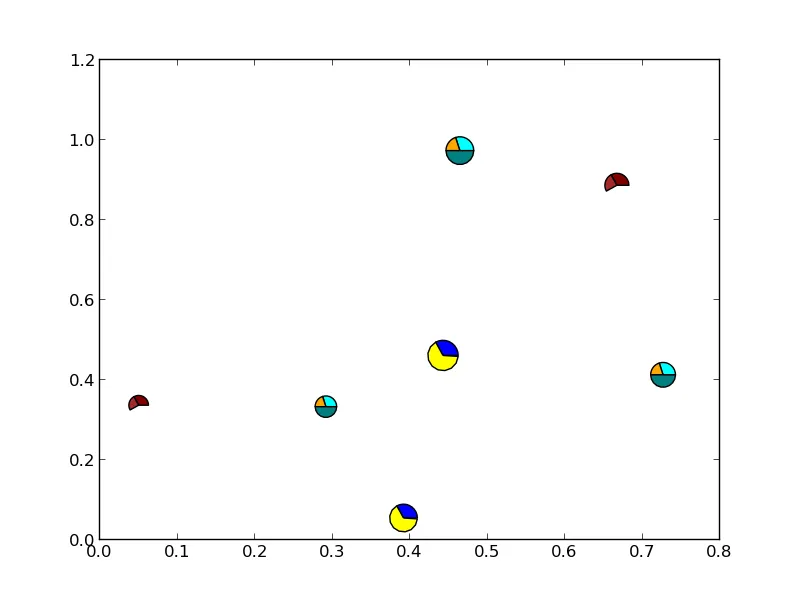
def drawPieMarker(xs, ys, ratios, sizes, colors):
assert sum(ratios) <= 1, 'sum of ratios needs to be < 1'
markers = []
previous = 0
# calculate the points of the pie pieces
for color, ratio in zip(colors, ratios):
this = 2 * np.pi * ratio + previous
x = [0] + np.cos(np.linspace(previous, this, 10)).tolist() + [0]
y = [0] + np.sin(np.linspace(previous, this, 10)).tolist() + [0]
xy = np.column_stack([x, y])
previous = this
markers.append({'marker':xy, 's':np.abs(xy).max()**2*np.array(sizes), 'facecolor':color})
# scatter each of the pie pieces to create pies
for marker in markers:
ax.scatter(xs, ys, **marker)
fig, ax = plt.subplots()
drawPieMarker(xs=np.random.rand(3),
ys=np.random.rand(3),
ratios=[.3, .2, .5],
sizes=[80, 60, 100],
colors=['cyan', 'orange', 'teal'])
drawPieMarker(xs=np.random.rand(2),
ys=np.random.rand(2),
ratios=[.33, .66],
sizes=[100, 120],
colors=['blue', 'yellow'])
drawPieMarker(xs=np.random.rand(2),
ys=np.random.rand(2),
ratios=[.33, .25],
sizes=[50, 75],
colors=['maroon', 'brown'])
plt.show()
x = [0, *np.cos(np.linspace(previous, this, 10)), 0]使得x = [0] + np.cos(np.linspace(previous, this, 10)).tolist() + [0]更易读。 - Guimoute
draw_pie([1, 1, 1, 12], 1, 1, 10000, ax=ax)。 - JohanC