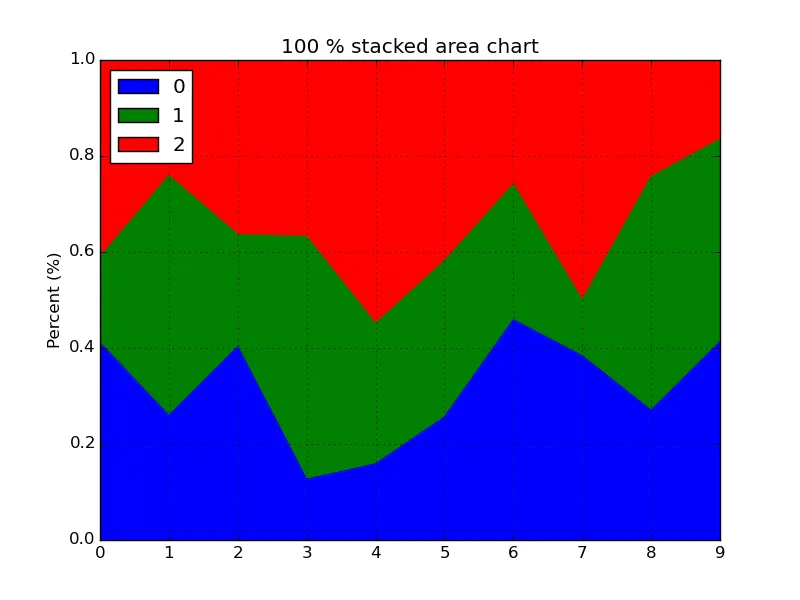
在 pandas 的文档 中,您可以找到有关区域图的讨论,特别是它们的堆叠。是否有一种简单直接的方法来获得一个像这个帖子中的100%区域堆栈图?
1个回答
16
该方法基本与其他SO答案相同:将每行除以行的总和:
df = df.divide(df.sum(axis=1), axis=0)
然后你可以像平时一样调用 df.plot(kind='area', stacked=True, ...)。
import numpy as np
import pandas as pd
import matplotlib.pyplot as plt
np.random.seed(2015)

y = np.random.randint(5, 50, (10,3))
x = np.arange(10)
df = pd.DataFrame(y, index=x)

df = df.divide(df.sum(axis=1), axis=0)
ax = df.plot(kind='area', stacked=True, title='100 % stacked area chart')

ax.set_ylabel('Percent (%)')
ax.margins(0, 0) # Set margins to avoid "whitespace"

plt.show()
- unutbu
2
网页内容由stack overflow 提供, 点击上面的可以查看英文原文,
原文链接
原文链接
pandas.DataFrame.plot.area()。 - Drorax.margins(0, 0)很容易出现问题,而且经常不能按预期工作。在现代的 matplotlib 中,ax.autoscale(enable=True, axis='both', tight=True)更好用。 - Mark_Anderson