我想知道如何在matplotlib中创建一个100%堆积面积图。在matplotlib页面上,我没有找到相关示例。
这里有人能向我展示如何实现吗?
我想知道如何在matplotlib中创建一个100%堆积面积图。在matplotlib页面上,我没有找到相关示例。
这里有人能向我展示如何实现吗?
实现这一目标的简单方法是确保对于每个x值,y值的总和为100。
我假设您已将y值按照以下示例组织为数组,即
y = np.array([[17, 19,  5, 16, 22, 20,  9, 31, 39,  8],
              [46, 18, 37, 27, 29,  6,  5, 23, 22,  5],
              [15, 46, 33, 36, 11, 13, 39, 17, 49, 17]])
y数组除以其列和,然后乘以100。这使得y值跨越从0到100的范围,使y轴的“单位”成为百分比。如果您希望y轴的值跨越从0到1的区间,则不要乘以100。y1,y2等)中的相应元素应该总和为100(或1)。import numpy as np
from matplotlib import pyplot as plt
fnx = lambda : np.random.randint(5, 50, 10)
y = np.row_stack((fnx(), fnx(), fnx()))
x = np.arange(10)
# Make new array consisting of fractions of column-totals,
# using .astype(float) to avoid integer division
percent = y / y.sum(axis=0).astype(float) * 100
fig = plt.figure()
ax = fig.add_subplot(111)
ax.stackplot(x, percent)
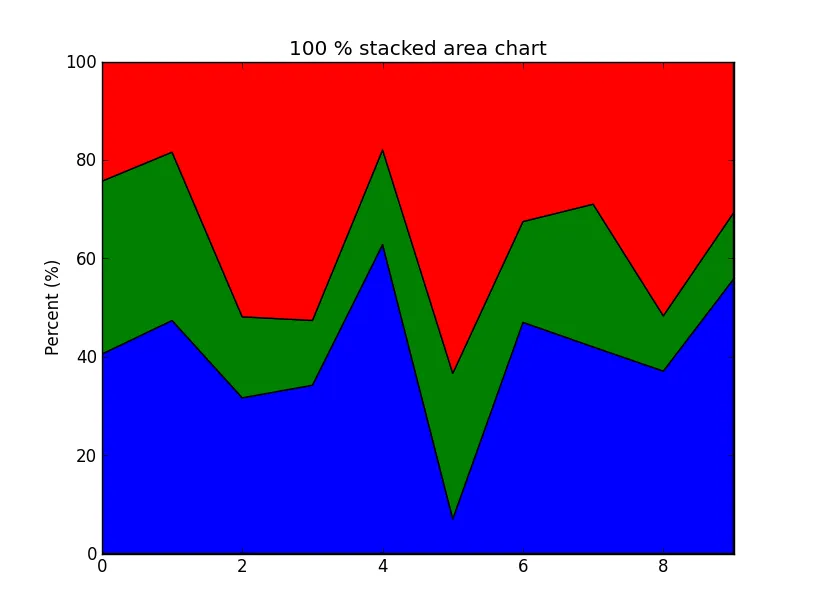
ax.set_title('100 % stacked area chart')
ax.set_ylabel('Percent (%)')
ax.margins(0, 0) # Set margins to avoid "whitespace"
plt.show()
这将产生如下所示的输出。
Traceback (most recent call last): File "<pyshell#49>", line 1, in <module> ax.stackplot(pressures) AttributeError: 'AxesSubplot'对象没有'stackplot'属性 - Magic_Matt_Manstackplot包含在1.1.1rc版本中。 - sodd