据我所知,
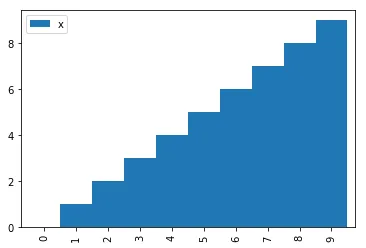
df.plot(drawstyle="steps")甚至不会存储计算的步进顶点;
out = df.plot(kind = 'line', drawstyle = 'steps')
stepline = out.get_lines()[0]
print(stepline.get_data())
(array([0, 1, 2, 3, 4, 5, 6, 7, 8, 9]), array([0, 1, 2, 3, 4, 5, 6, 7,
8, 9])),因此我认为你需要自己编写代码。这意味着在点列表中的每个
(x[i],y[i]) 后面直接插入
(x[i+1],y[i]):
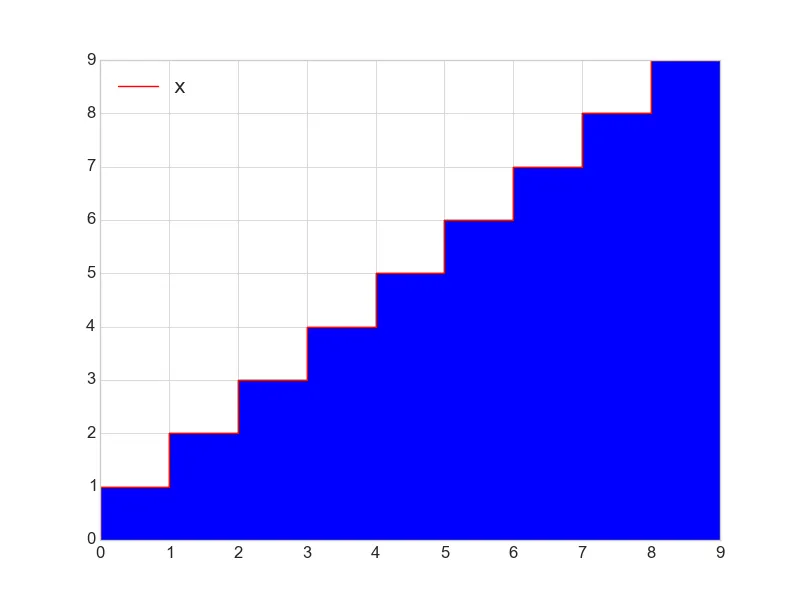
df = pd.DataFrame({'x':range(10)})
x = df.x.values
xx = np.array([x,x])
xx.flatten('F')
doubled = xx.flatten('F')
plt.fill_between(doubled[:-1], doubled[1:], label='area')
ax = plt.gca()
df.plot(drawstyle = 'steps', color='red', ax=ax)